
Japanese Candlesticks: The Complete Trading Guide
Learn to read Japanese candlesticks, decode market psychology, and spot high-probability reversal patterns for smarter trading decisions.
Key takeaways:
- Japanese candlesticks turn confusing price data into visual stories that any trader can read.
- Each candlestick reveals the tension between buyers and sellers in a specific trading period.
- Reading Japanese candlesticks for beginners starts with understanding just four price points: open, high, low, and close.
- Reversal patterns like hammers and shooting stars can provide more obvious entry signals than traditional indicators.
- Combining candlestick patterns with volume and support/resistance levels dramatically improves trading accuracy.
Every day, millions of traders stare at charts trying to anticipate what the market will do next. Line charts show basic price movement, bar charts add some detail, but Japanese candlesticks tell the complete story of market psychology in action.
Here's what makes Japanese candlesticks special: they don't just show where the price went, they can also reveal the psychological battle between buyers and sellers that drove every move.
By the end of this guide, you'll understand how to read the market's emotional state through Japanese candlesticks, spot high-probability reversal patterns, and combine candlestick analysis with other technical tools for better trading decisions.
Understanding Japanese Candlesticks: Anatomy and Basics
Japanese candlesticks are a charting method that displays the open, high, low, and close prices for any time period. The candlestick shows these four price points in a visual format that reveals market activity during specific trading sessions.
The wide part of the candlestick is called the "real body" and tells traders whether the closing price is higher or lower than the opening price. It appears as black/red if the security closed lower or white/green if the security closed higher.
The candlestick's shadows show the period's high and low prices and how they compare to the open and close. The shape varies based on the relationship between the day's high, low, opening, and closing prices.
Japanese candlesticks reflect the impact of trader sentiment on security prices. They are used by technical analysts to determine when to enter and exit trades. Candlestick charting is based on a technique developed in Japan in the 1700s for tracking rice prices. Today, many traders apply candlestick charts to different liquid financial assets such as stocks, foreign exchange, and futures, though outcomes remain somewhat uncertain and depend on broader market conditions.
Trading platforms use color coding to distinguish price direction. A green candlestick indicates that the closing price was higher than the opening price. A red candlestick shows the closing price was lower than the opening price.
Reading Japanese Candlesticks: Decoding Market Psychology
Reading Japanese candlesticks means identifying formations that show market sentiment and where prices might head next. Individual candlestick formations give traders potential signals about the balance between buying and selling pressure.
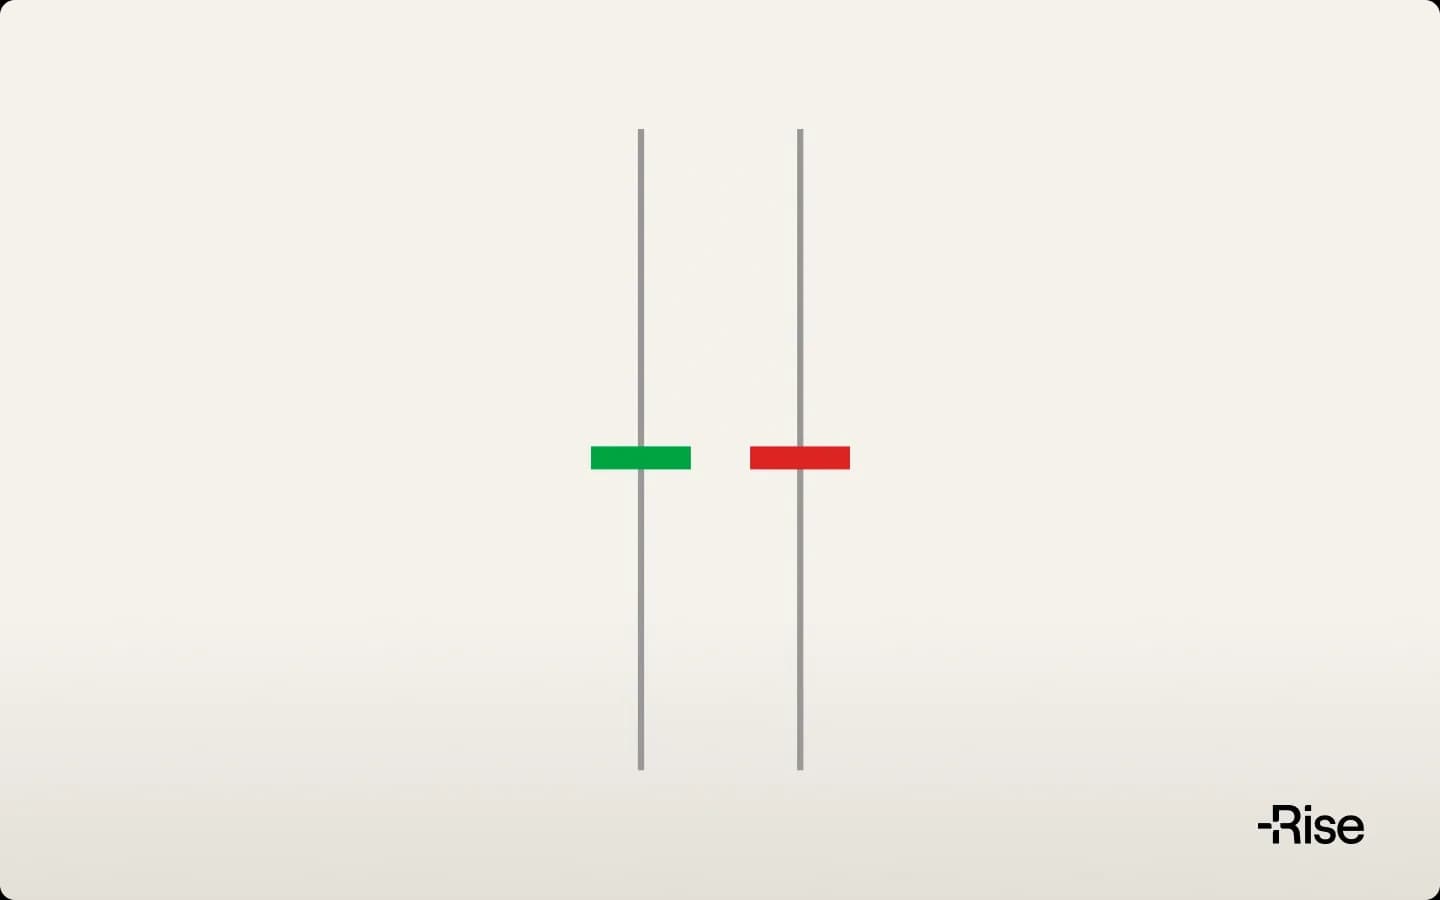
Doji candlesticks occur when the opening and closing prices are identical or nearly identical. The body appears as a thin line, but shadows vary in length. A doji signals indecision in the market where neither buyers nor sellers could gain control during that time period.
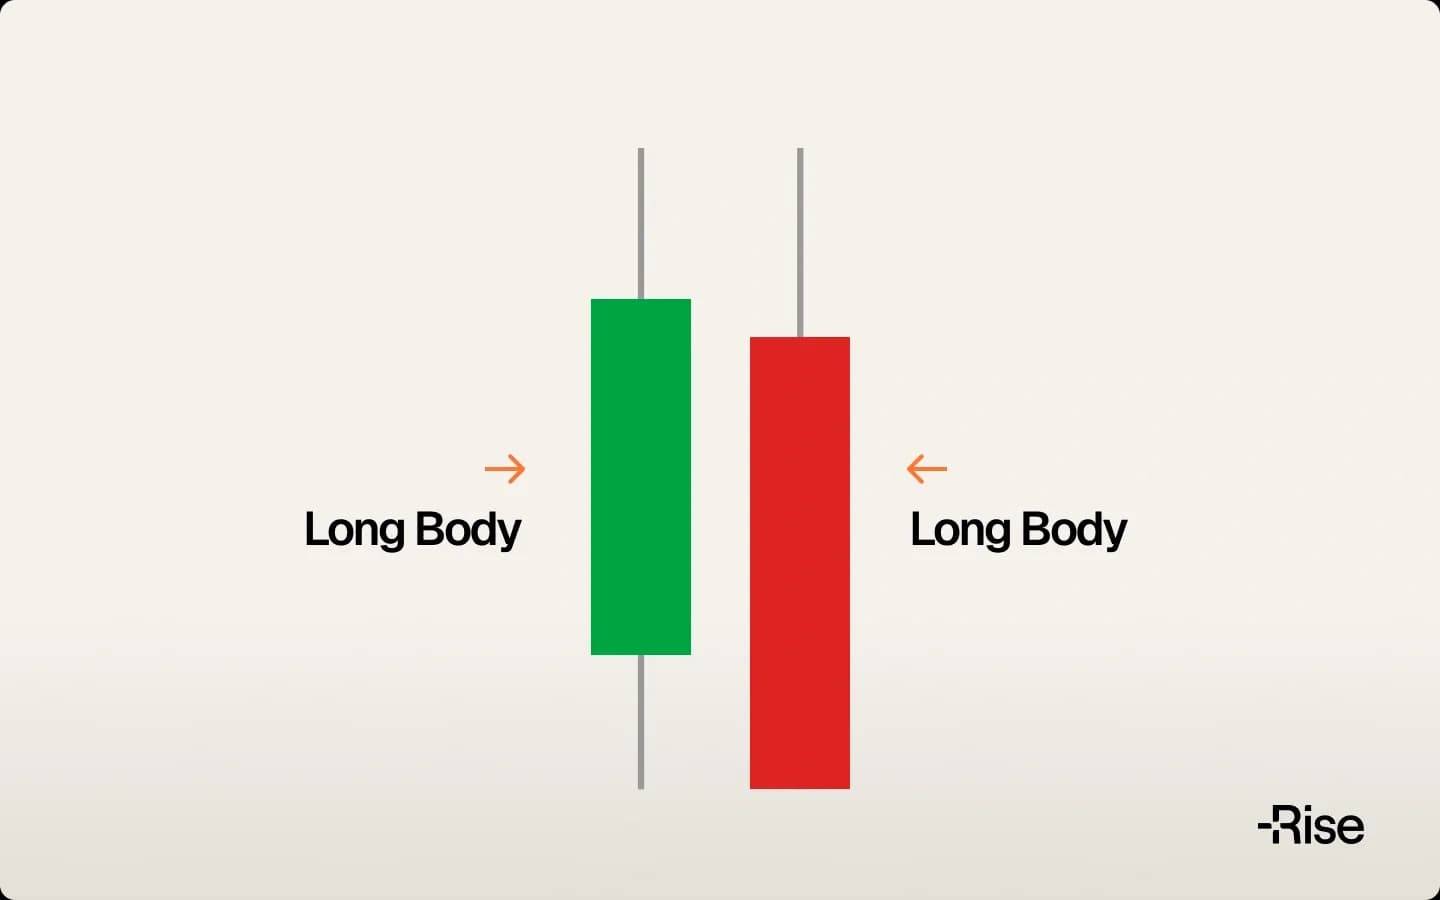
The long candlestick indicates strong conviction in the market. Long white/green candlesticks indicate strong buying pressure and suggest that price is bullish. Long black/red candlesticks indicate significant selling pressure and suggest that the price is bearish. Very large candlesticks typically signal strong momentum and can indicate breakouts from trading ranges.
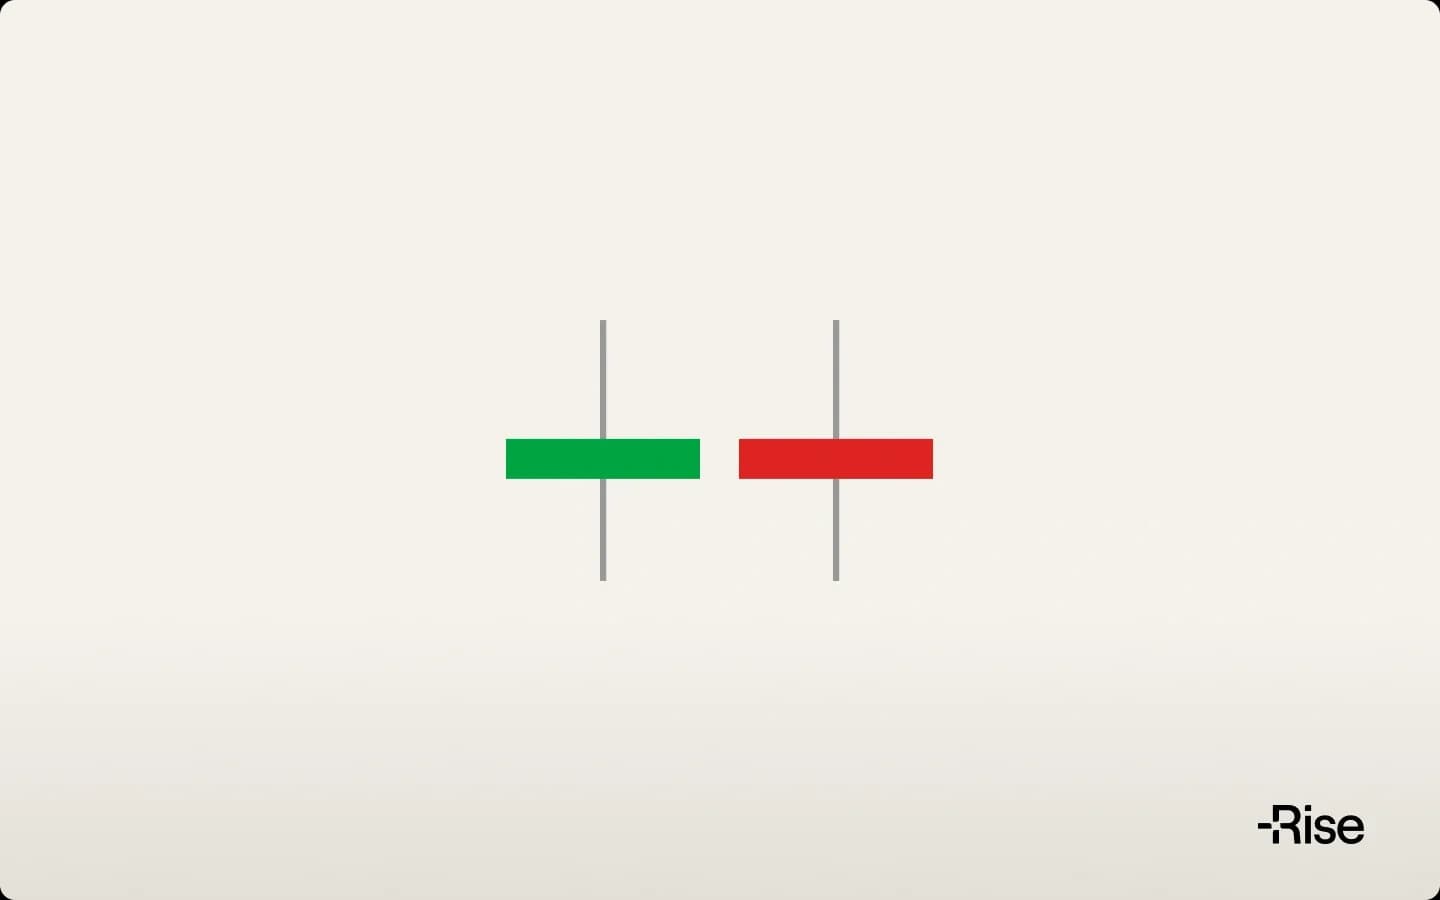
Spinning tops have small bodies with lengthy shadows on both sides. These candlesticks show the market moving between buyers and sellers without clear direction. The small body means the open and close were similar, while extended shadows reveal that price moved significantly in both directions during the session.
Shadows deserve attention because they show failed attempts at price movement. A long upper shadow reveals that buyers tried to push price higher but failed to hold those levels. A long lower shadow indicates sellers drove price down but couldn't maintain the lows.
Traders can use candlestick signals to analyze all periods of trading, including daily or hourly cycles. The timeframe affects the significance of the pattern, with longer timeframes generally producing more reliable signals than shorter periods.
Essential Japanese Candlestick Patterns Every Trader Should Know
If you're looking to trade with candlesticks, you'll want to know the most common patterns. These fall into single-candle patterns, dual-candle patterns, and triple-candle patterns.
Single Candlestick Patterns
Hammer and Hanging Man patterns look the same but mean different things. Both have small bodies with long lower shadows. The hammer shows up after a downtrend and suggests buyers are stepping in. The hanging man appears after an uptrend and warns that sellers might take control.
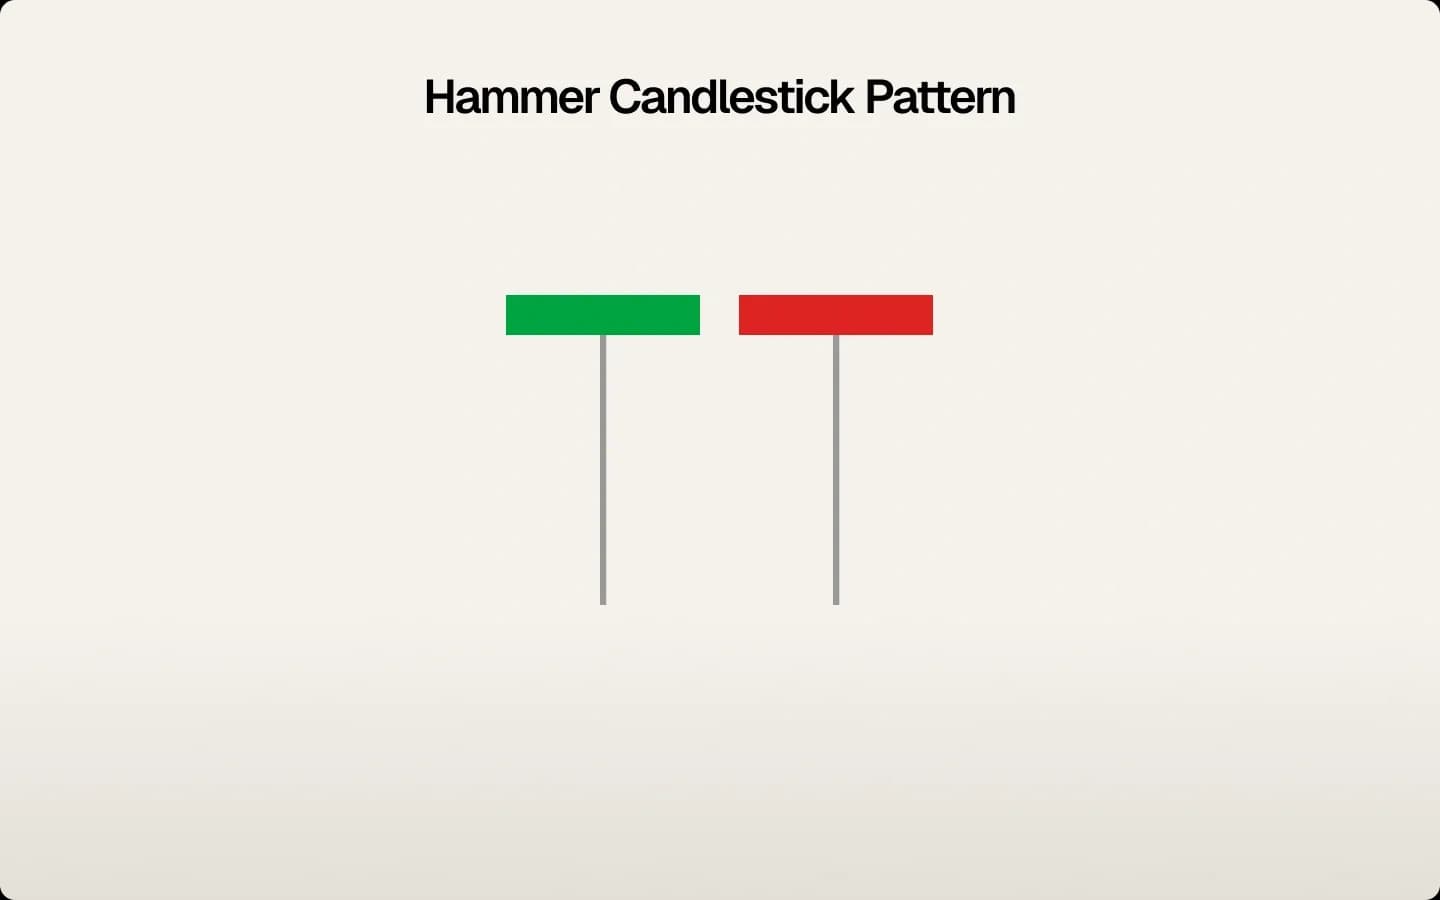
The psychology is straightforward: sellers pushed prices down during the session, but buyers fought back and managed to close near the highs. After a decline, this suggests selling pressure is running out. After a rally, it means buying interest might be weakening.
Shooting stars are hammers flipped upside down. They have small bodies with long upper shadows and typically appear after uptrends. Buyers tried to push prices higher but couldn't hold those levels. Sellers stepped in and drove prices back down.
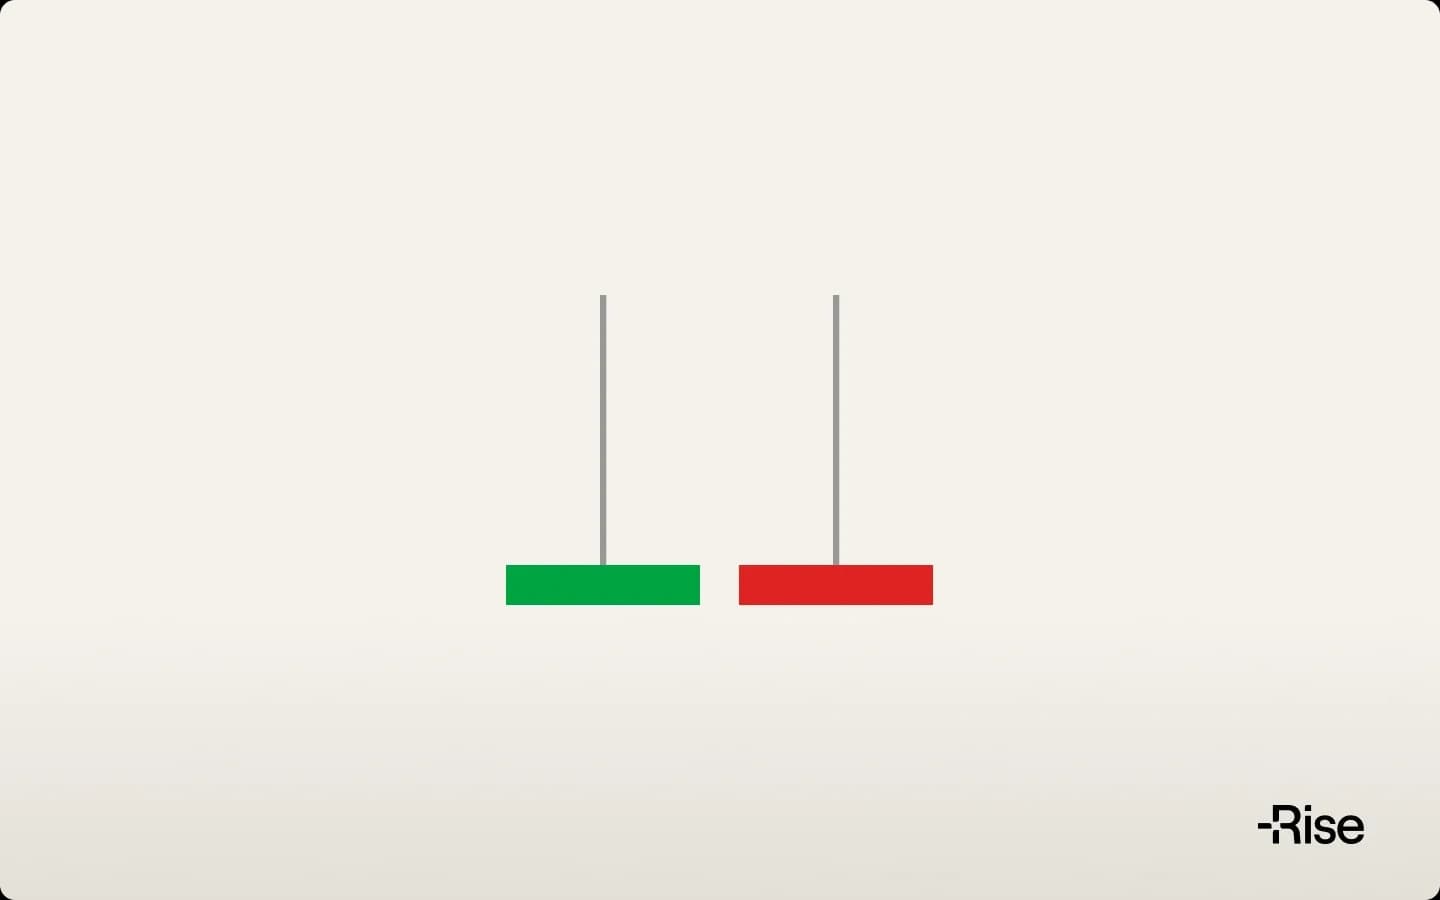
Doji patterns happen when the open and close are nearly the same. The gravestone doji has an upper shadow with no lower shadow. The dragonfly doji has a lower shadow with no upper shadow. Regular dojis have shadows in both directions. All doji types show indecision in the market.
Dual Candlestick Patterns
Engulfing patterns occur when the second candle's body completely swallows the first candle's body. A bullish engulfing pattern shows a small red candle followed by a larger green candle that opens lower and closes higher than the red candle's entire range. The bearish version does the opposite.
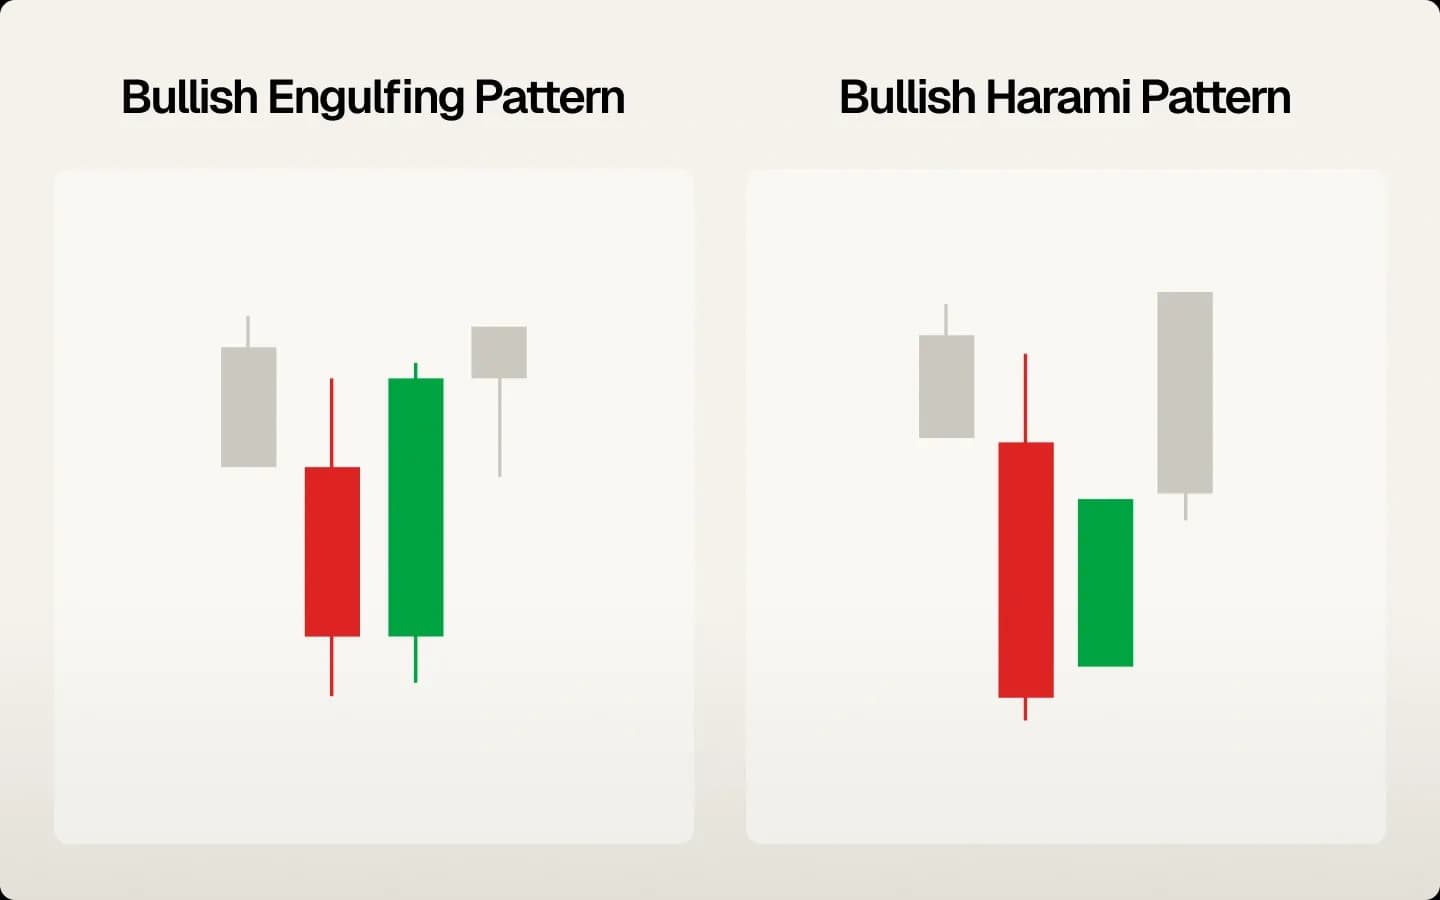
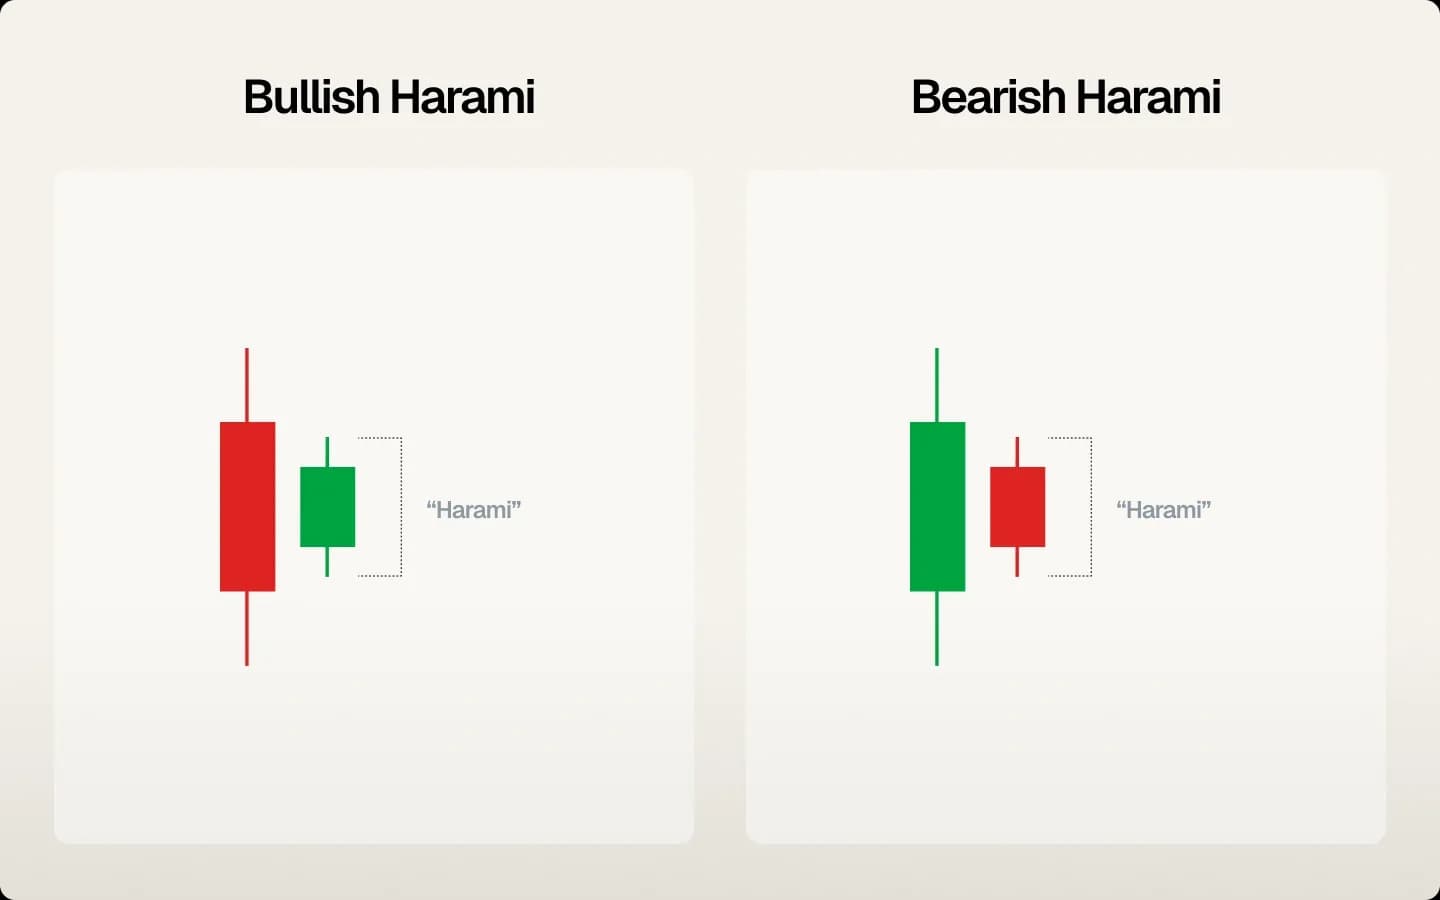
Harami patterns work the opposite way. The second candle's body fits within the first candle's body. The name means "pregnant" in Japanese because the smaller candle appears nestled inside the bigger one. These patterns show momentum is slowing down.
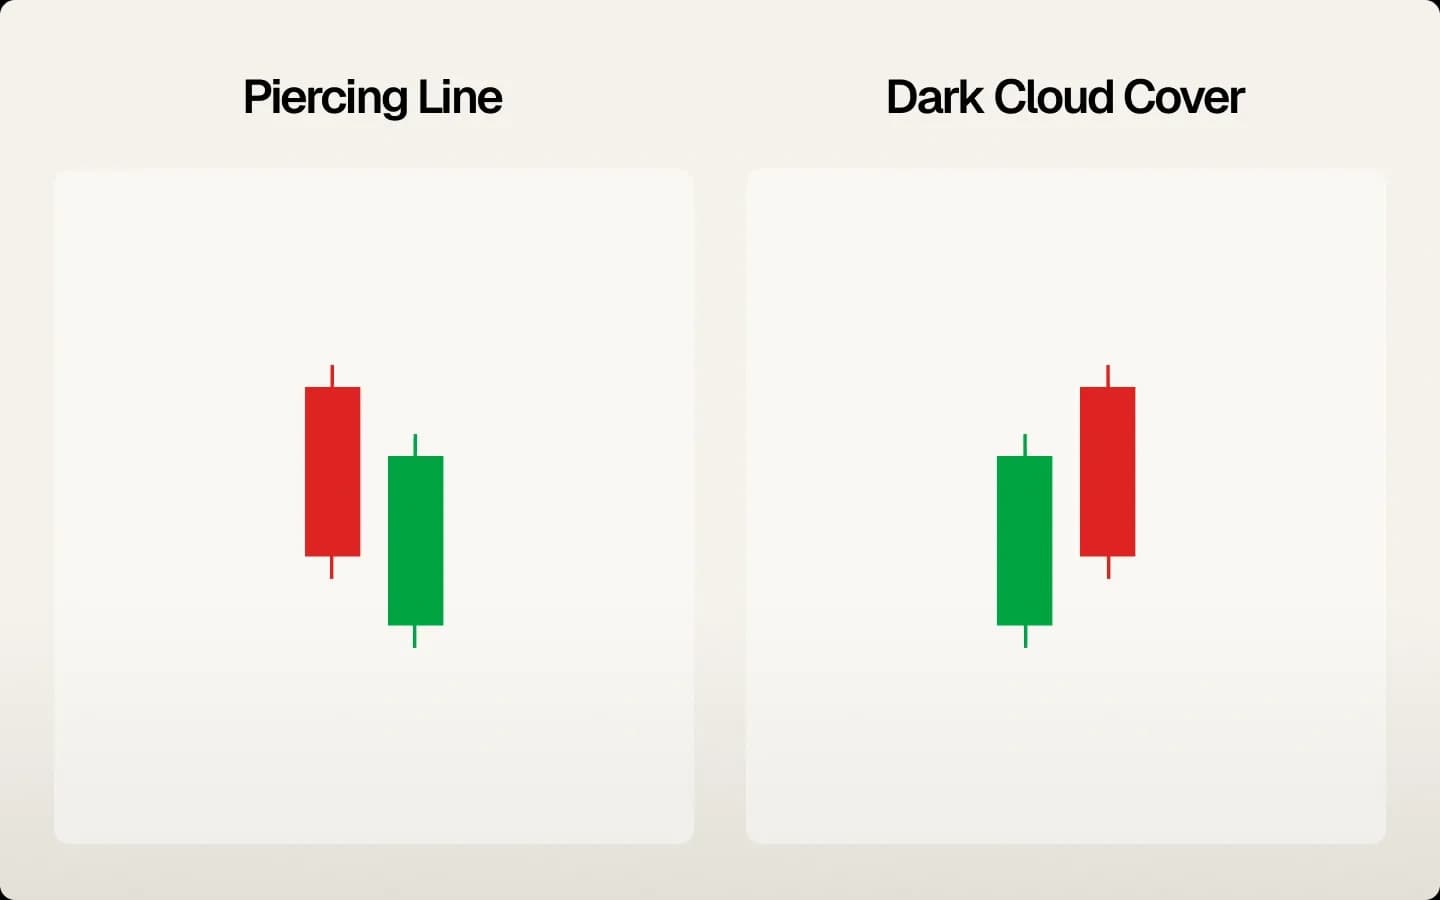
Piercing patterns and dark cloud cover are partial engulfing patterns. A piercing pattern happens when a green candle opens below a red candle's close but recovers to finish above the red candle's midpoint. Dark cloud cover occurs when a red candle opens above a green candle's close but falls to finish below the green candle's midpoint.
Triple Candlestick Patterns
Morning stars and evening stars are three-candle reversal patterns. A morning star starts with a long red candle, continues with a small candle, and finishes with a long green candle. This shows selling giving way to indecision, then buyers taking charge.
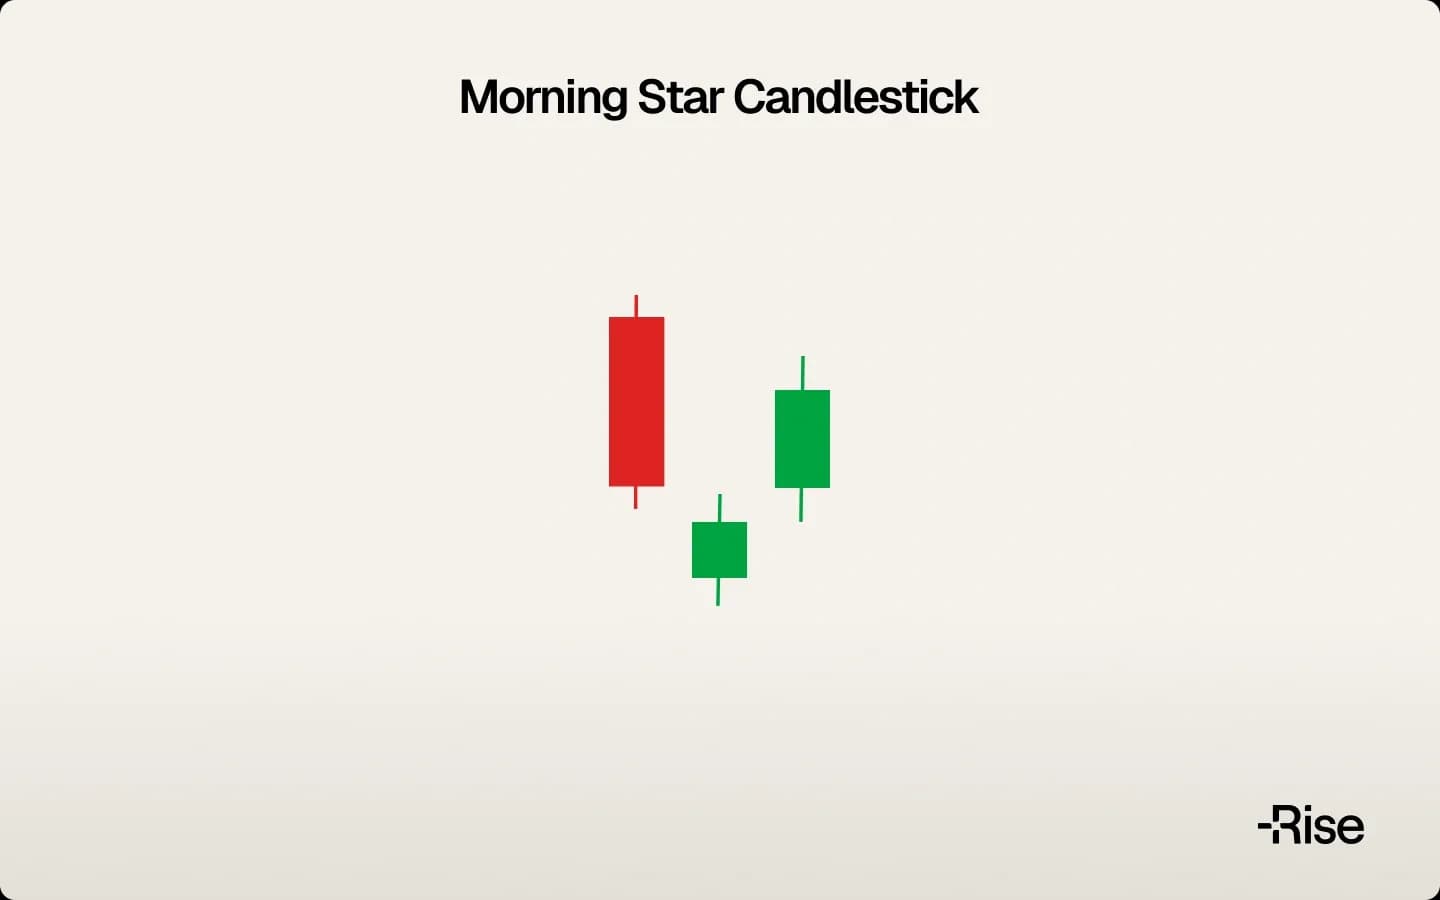
Evening stars work in reverse. They start with a long green candle, include a small middle candle, and end with a long red candle. This shows buying momentum fading into indecision, then sellers taking control.
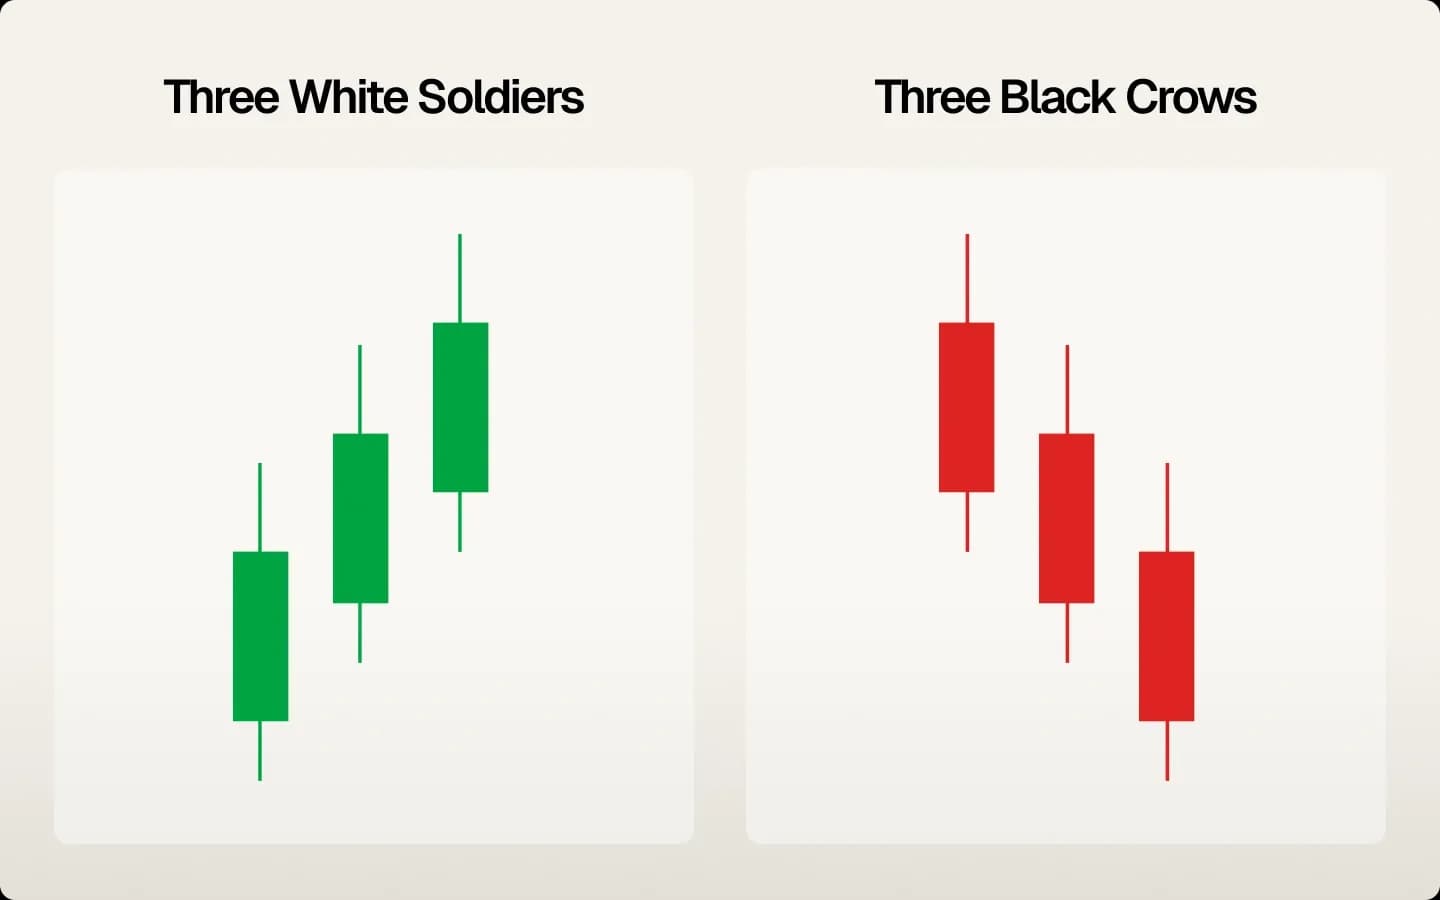
Three white soldiers and three black crows show sustained moves. Three white soldiers display three consecutive long green candles, each opening within the previous candle's body but closing higher. Three black crows show three consecutive long red candles following the same pattern downward.
Mastering Japanese Candlestick Reversal Signals
Japanese candlestick reversal patterns work better at logical turning points. A hammer at major support carries more weight than a hammer in the middle of a trading range. Context matters as much as pattern recognition.
Volume adds another layer of confirmation. When a bullish reversal pattern forms on heavy volume, you're seeing real buying interest, not just technical bounces. Similarly, bearish reversal patterns with high volume indicate genuine selling pressure, not just profit-taking.
The stronger the preceding trend, the more significant the reversal pattern becomes. A doji after a 50% stock rally deserves attention. The same doji in a sideways market probably doesn't mean much.
Traders handle reversal candlesticks differently. Some jump in immediately when they spot the formation. Others wait for the next candle to confirm the signal. Both methods have trade-offs - entering early might catch more of the move, but waiting for confirmation reduces false signals.
Not all reversal patterns work out. Sometimes they form but the original trend continues anyway. This usually happens when the existing trend has too much momentum or when news events override technical signals. Successful traders know when to cut their losses on reversal trades that aren't working.
Positive Japanese Candlesticks vs. Bearish Signals
Positive Japanese candlesticks reveal bullish market sentiment through their structure and appearance on charts. Bullish formations show buyers gaining control and typically lead to upward price movement.
Strong bullish candlesticks feature large green bodies with small shadows. Bullish patterns show buyers controlled most of the trading session, pushing prices steadily higher throughout the period. When these appear after pullbacks in uptrends, they signal trend continuation.
Red candles don't automatically signal bearish conditions. Context matters in candlestick analysis. A red candle with a long lower shadow can actually be bullish if it shows buyers defended a key price level. A series of small red candles after a large green advance might simply represent normal profit-taking rather than trend reversal.
The sequence of green and red candlesticks provides clues about market sentiment. A series of long green candlesticks followed by short red ones suggests buyers remain in control. Long red candlesticks followed by weak green bounces indicate sellers dominate the market.
Understanding accumulation and distribution through candlesticks helps gauge market direction. During accumulation phases, patterns like hammers, bullish engulfing, and morning stars appear frequently. Distribution phases feature shooting stars, bearish engulfing patterns, and evening stars.
Market context determines whether positive or negative candlestick signals carry more weight. In strong uptrends, focus on bullish patterns for continuation signals while treating weak bearish patterns with caution. In downtrends, emphasize bearish patterns while viewing bullish signals skeptically unless they show exceptional strength.
Japanese Candlesticks for Beginners: Getting Started
Japanese candlesticks for beginners should start with mastering the fundamentals before moving to complex patterns. This step-by-step approach builds confidence without overwhelming new traders with excessive information.
Learn basic candlestick anatomy first. Practice on demo accounts identifying the open, high, low, and close on different candlesticks. Learn to distinguish between large and small bodies, long and short shadows, and green versus red candlesticks.
Focus on learning these five patterns first: doji, hammer, shooting star, engulfing patterns, and morning/evening stars. These Japanese candlestick patterns appear frequently in all markets and timeframes, providing ample practice opportunities.
Common beginner mistakes include pattern hunting, ignoring market context, and trading patterns without confirmation. Avoid these pitfalls by requiring multiple confirmations before acting on candlestick signals.
Start with longer timeframes like daily or 4-hour charts where patterns are clearer and more reliable. Shorter timeframes contain more noise and false signals that can discourage beginners. As skills develop, traders can gradually move to shorter periods.
Build confidence through paper trading with candlestick patterns. Track hypothetical trades for several months, noting which patterns work best in different market situations. This method provides experience without financial risk.
The key for Japanese candlesticks for beginners: patience and practice. Don't trade every pattern immediately. Focus on the highest-probability setups in favorable market conditions while building pattern recognition skills through regular study.
Taking Your Candlestick Analysis to the Next Level
Advanced candlestick analysis combines patterns with other technical tools for higher-probability trades. Moving averages provide trend context for candlestick patterns. A bullish reversal pattern near a rising 50-day moving average carries more significance than one occurring during a downtrend.
Support and resistance levels amplify candlestick signals. Hammer patterns at major support levels or shooting stars at resistance create powerful trading setups. The combination of price levels and candlestick psychology often produces the most reliable signals.
Different market conditions require different candlestick approaches. In trending markets, focus on continuation patterns like pullback hammers or breakaway formations. In ranging markets, emphasize reversal patterns at support and resistance boundaries.
Risk management with candlestick patterns involves setting stops beyond pattern invalidation levels. For bullish reversal patterns, place stops below the pattern's low. For bearish reversals, set stops above the pattern's high. This approach limits losses when patterns fail to follow through.
Candlestick patterns fail when underlying market forces overwhelm pattern psychology. Strong earnings announcements, Federal Reserve decisions, or major news events can invalidate even reliable patterns. Successful traders adapt when fundamental factors override technical signals.
Position sizing becomes important with candlestick trading since patterns can fail. Risk only 1-2% of capital per trade, allowing room for multiple attempts as patterns develop. This conservative approach preserves capital during losing streaks while maintaining exposure to profitable setups.
Conclusion
Japanese candlesticks transform raw price data into actionable market intelligence. From Munehisa Homma's rice trading innovations to modern electronic markets, these patterns continue revealing the battle between buyers and sellers.
The power of Japanese candlesticks comes from their simplicity and universal application. Whether trading stocks, forex, or cryptocurrencies, the same patterns work across all markets because they reflect fundamental human psychology.
Success with candlestick analysis requires practice, patience, and solid risk management. Start with basic patterns, master them through repetition, then add more advanced strategies as your trading skills improve. Candlesticks work best when combined with other technical tools rather than used alone.
The strongest candlestick signals occur when patterns match up with market conditions, volume confirmation, and key technical levels. These confluences create high-probability setups that experienced traders rely on for consistent results.
Most importantly, understand that Japanese candlesticks are tools for reading market sentiment, not guarantees of future price direction. They help gauge the balance between buyers and sellers, but markets remain unpredictable. Proper risk management ensures survival during inevitable surprises while capitalizing on patterns that work.
Japanese candlesticks have evolved from 18th-century rice markets to become a core part of modern technical analysis. Their continued popularity comes from their ability to visualize market emotion and participant behavior in ways that simple line charts cannot match.
Frequently Asked Questions

Learn how to trade Doji candlesticks: the three types, their success rates, and how to confirm reversals with volume and proper risk management.
Read more
Learn how to read forex trading charts including line, bar, and candlestick types, OHLC data, timeframes, and support/resistance levels.
Read more
Risk management in trading protects your capital. Learn the 1-2% rule, stop-losses, and position sizing to limit losses and trade profitably.
Read more