
Doji Candlestick: What They Are and How to Trade
Learn how to trade Doji candlesticks: the three types, their success rates, and how to confirm reversals with volume and proper risk management.
Key takeaways:
- A doji forms when opening and closing prices are equal or within 5% of each other, creating a cross-shaped candlestick.
- Three main types exist: gravestone (bearish), dragonfly (bullish), and long-legged (neutral).
- Doji patterns require confirmation from the next candle before trading.
- Success rates range from 40-65% depending on market context and confirmation, though past performance is not indicative of future results.
- It works best at major support/resistance levels after extended trends.
What Is a Doji Candlestick?
A doji is a candlestick pattern where the open and close prices of a security are virtually equal, forming a candle that looks like a cross, inverted cross, or plus sign. The word "doji" comes from Japanese, meaning "the same thing," referring to the rarity of identical opening and closing prices.
Technical analysts watch for doji because they can signal turning points in the market. While doji formations appear in just 5-8% of trading sessions according to pattern studies, they frequently precede important reversals when they form at key price levels. The pattern matters because it captures a rare moment when buying and selling pressures reach equilibrium.
Japanese rice trader Honma from Sakata developed candlestick analysis in the 18th century, and Steve Nison introduced these techniques to Western markets in his 1991 book "Japanese Candlestick Charting Techniques." Every candlestick has four data points: open, high, low, and close. In a doji, the open and close prices are nearly identical (within 5% of the total range), creating minimal body, while the wicks or shadows show where prices traveled during the session.
From an auction theory perspective, doji show indecision between buyers and sellers. The price moves during the session but closes where it started, indicating neither side could maintain control. Markets rarely stay undecided for long. When doji appear alongside support and resistance levels, volume changes, and existing trends, they become useful tools for spotting potential reversals.
The Three Types of Doji Patterns
Pattern Type | Shadow Formation | Market Signal | Success Rate* | Best Location |
Gravestone Doji | Long upper shadow, no lower shadow | Bearish reversal | 57% (65% with volume) | Resistance levels, after 20%+ rallies |
Dragonfly Doji | Long lower shadow, no upper shadow | Bullish reversal | 61% at major support | Support levels, oversold conditions |
Long-Legged Doji | Long shadows both directions | Maximum indecision | 45% alone, 62% with indicators | Consolidation zones, before news |
*Past performance is not indicative of future results.
Gravestone Doji
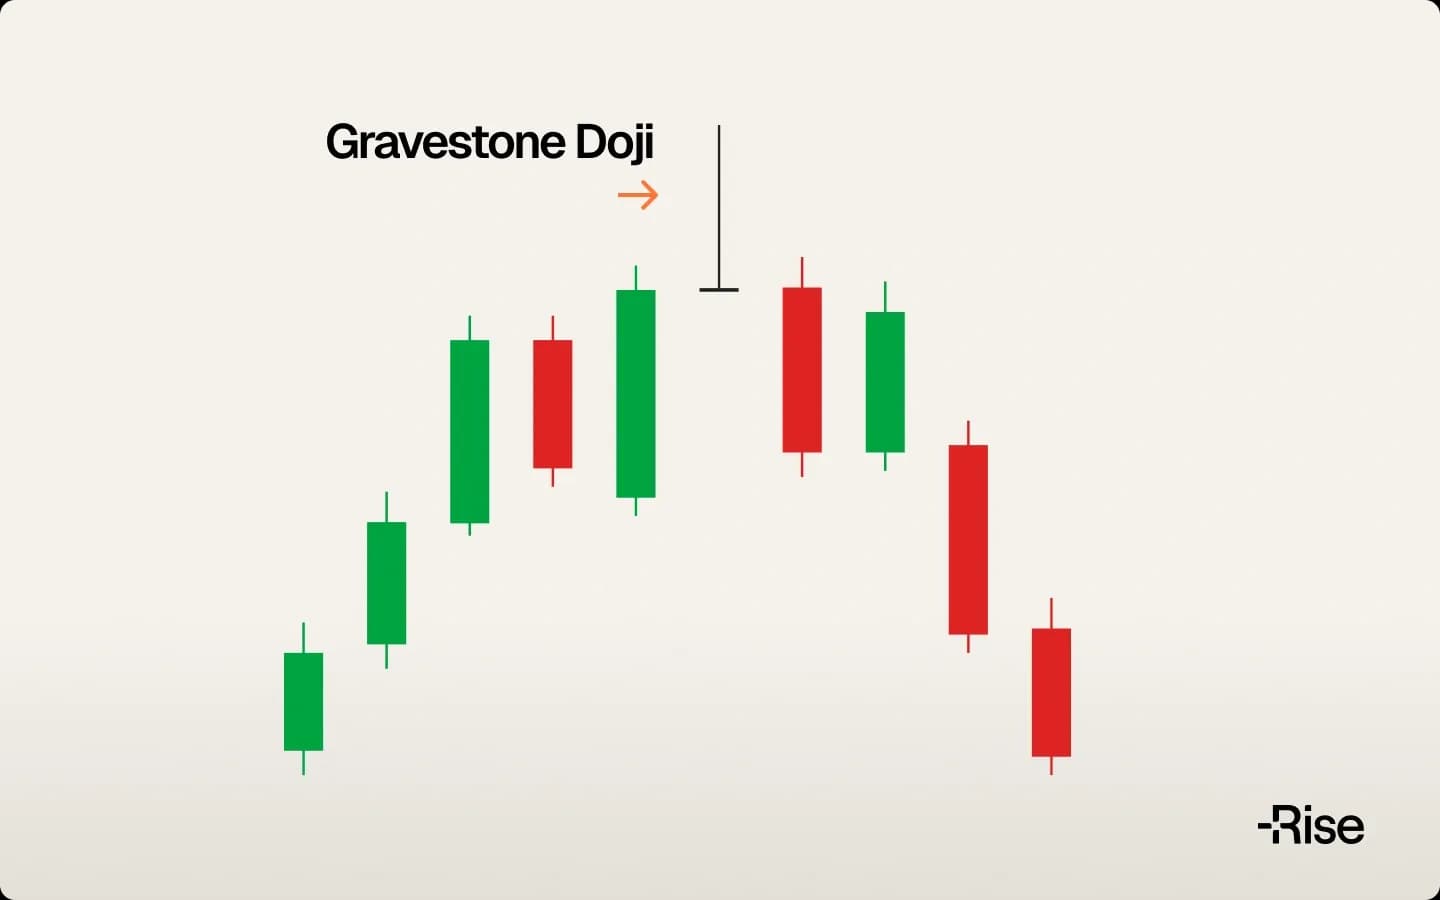
A gravestone doji has a long upper shadow with little to no lower shadow. The opening, closing, and low prices cluster at the same level. This means that during the session, buyers pushed prices higher, but sellers took control and drove prices back down to where they started. The visual appearance resembles a gravestone, giving this bearish pattern its name.
A gravestone doji are believed to work best as bearish reversal signals at resistance levels or after stocks have rallied 20% or more. According to Thomas Bulkowski's "Encyclopedia of Chart Patterns," a gravestone doji at resistance predicts reversals 57% of the time. This rate could potentially increase to 65% when trading volume is above the 20-day average, as higher volume confirms stronger selling interest.
To trade a gravestone, wait for the next day's candle. If it closes below the gravestone's low price, that's your signal to consider a short position or to exit longs. Place your protective stop above the gravestone's high (the top of the upper shadow) and look for profit targets at the next support level below or aim for gains that are twice your risk.
Dragonfly Doji
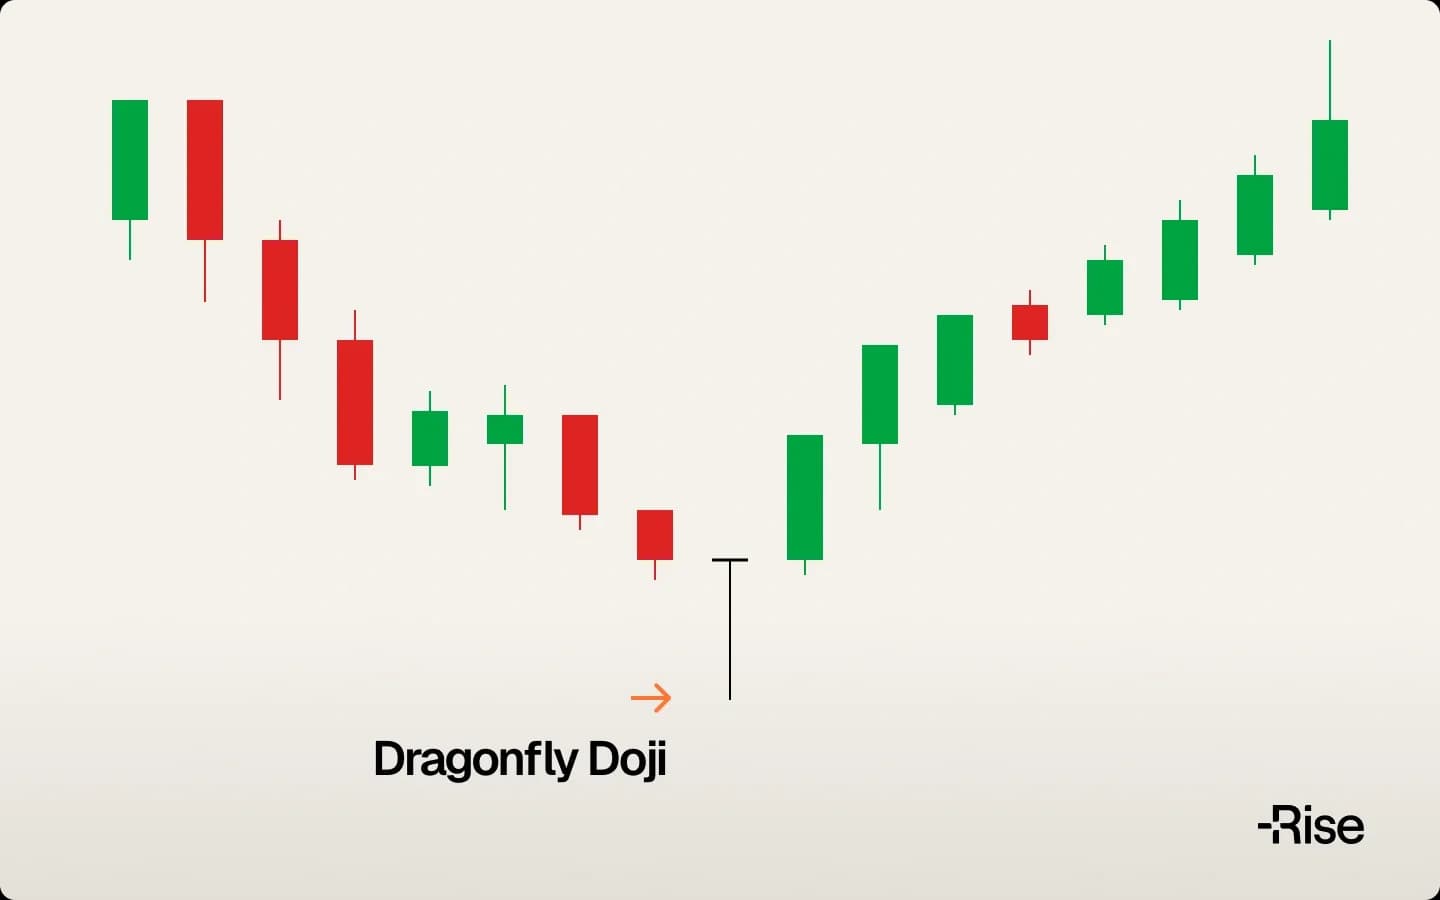
A dragonfly doji shows a long lower shadow with minimal upper shadow. Opening, closing, and high prices align at the top. During the session, sellers drove prices lower, but buyers stepped in and pushed prices all the way back up to the opening level. This rejection of lower prices frequently indicates buyers are gaining strength.
A dragonfly doji at major support levels correctly predicts bullish reversals 61% of the time according to pattern studies. The pattern works best after stocks have fallen 20% or more from recent highs. Because markets can get unpredictable, always wait for confirmation and manage risk carefully. To confirm the signal, watch for the next day's candle to close above the dragonfly's high price. That's when you might consider entering a long position. Place your protective stop below the dragonfly's low (bottom of the lower shadow) and target the next resistance level or profits twice your risk amount.
Long-Legged Doji
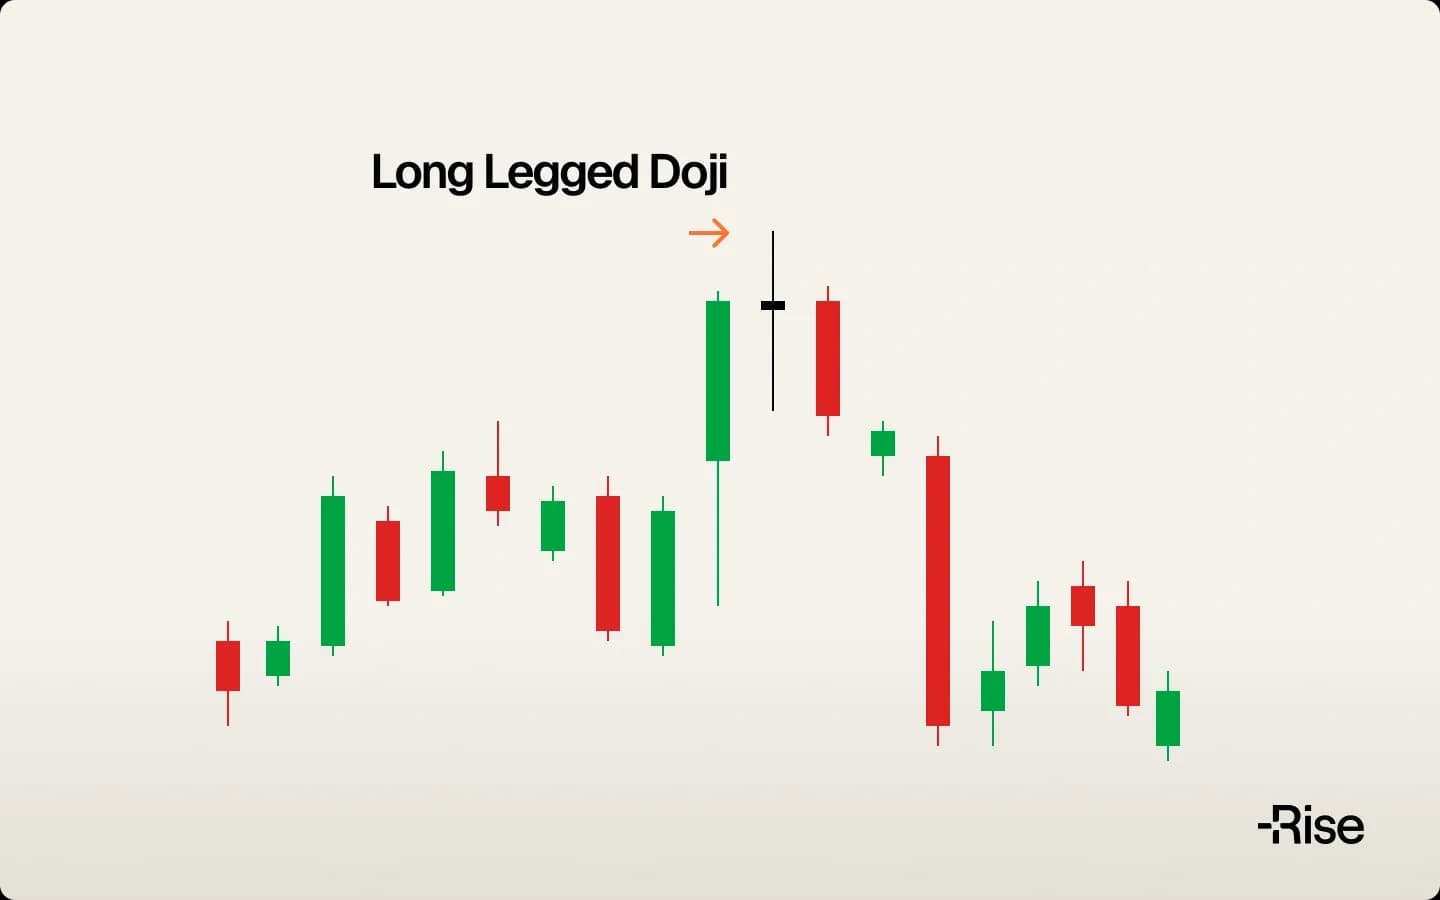
A long-legged doji has extended shadows stretching far above and below the open/close level, showing extreme price volatility during the session. It means that both buyers and sellers made strong attempts, but neither won. The price swung wildly but ended where it began. This extreme indecision makes this pattern the hardest to trade.
Without additional signals, a long-legged doji has historically predicted direction only 45% of the time - worse than a coin flip. But when combined with other indicators like RSI (Relative Strength Index) showing oversold or overbought conditions, or MACD (Moving Average Convergence Divergence) showing momentum shifts, its effectiveness may improve to 62%. Never trade these patterns by themselves; always wait for strong confirmation from price action over the next few sessions.
How to Trade Doji Patterns
Doji patterns by themselves don't tell you when to buy or sell. They're warning signs that something might be changing. To trade them successfully, you need context, confirmation, and proper risk management.
A tradeable doji setup needs three things. First, the doji must form at an important price level: this could be a previous high or low that acted as support or resistance, a round number like $50 or $100, or a widely watched moving average like the 50-day or 200-day. Second, you need confirmation, which means waiting to see what happens in the next trading session. If you spot a dragonfly doji at support, you want the next day to close higher than the doji's high before buying. Third, check the volume; it should be at least as high as the average of the past 20 days. Higher volume means more traders are participating, making the signal more reliable.
Getting In and Out of Trades
Let's walk through a real example. Say you spot a dragonfly doji in XYZ stock at $150, right at a support level that held three times before. The next day, XYZ stock opens at $151 and keeps climbing, closing at $153. This next-day close above the doji's high of $151.50 could be used as confirmation by traders considering a potential entry.
Where might a protective stop be placed? Often below the dragonfly's low. If that low was $148, you might set your stop at $147.50, giving a little room for normal price movement. Your risk is $5.50 per share ($153 entry minus $147.50 stop).
For a potential profit target, traders often look at the next resistance level. If XYZ stock previously struggled at $163, that's a logical target. That gives you a $10 potential profit versus $5.50 risk. Professional traders call this roughly a "2:1 risk-reward ratio": you're trying to make $2 for every $1 you risk. Even if you're only right half the time with 2:1 trades, you could still make money overall.
How many shares might a trader consider buying? For illustration, if an account is $10,000 account and the traders follow the common rule of risking no more than 2% per trade, the risk would be $200. With $5.50 risk per share, this example shows roughly 36 shares ($200 ÷ $5.50 = 36.4, round down to 36).
Advanced Doji Strategies
Looking at multiple time periods strengthens doji signals. Think of it like using different magnifications on a microscope. Check the weekly chart first to see the big picture: is the stock in an uptrend or downtrend? Where are the major support and resistance levels? Then look at the daily chart for your doji pattern. Finally, use the hourly chart to fine-tune your entry.
For example, if you see a daily dragonfly doji right at a support level that's also visible on the weekly chart, and the hourly chart starts showing higher lows and higher highs, you have alignment across different time perspectives. Different groups of traders watch different timeframes, so when they all see the same thing, moves tend to be stronger.
Technical indicators help confirm what the doji is suggesting. RSI measures whether a stock is overbought (above 70) or oversold (below 30). A gravestone doji with RSI above 70 strongly suggests prices are too high and ready to fall. A dragonfly doji with RSI below 30 indicates an oversold bounce could be coming.
Moving averages matter because many traders watch them. The 50-day and 200-day moving averages are particularly important. When a doji forms right at one of these averages, it often leads to a stronger reaction because so many traders are making decisions at that level.
Market conditions change how reliable doji patterns are. During strong trends, only trade doji that align with the trend direction; if the market is trending up, focus on bullish dragonfly doji at support during pullbacks. In sideways markets, trade doji at the top and bottom of the range. Avoid trading doji right before major announcements, like Federal Reserve meetings or earnings reports, as these events can override any technical pattern.
Common Mistakes to Avoid
The biggest mistake is trading a doji immediately without waiting for confirmation. Studies show about 70% of unconfirmed doji patterns don't produce the expected move. You might see a perfect gravestone doji and get excited, but if the next day gaps up and keeps rising, that bearish signal failed. Waiting one more day for confirmation dramatically improves your odds.
Volume matters more than most traders realize. A doji forming on half the normal volume likely just means traders are absent, not undecided. But a doji on twice the average volume? That shows real participation and conflict between buyers and sellers. Those are the ones to watch.
Timeframe selection makes a huge difference. A doji on a 5-minute chart means almost nothing, it's just noise. Daily and weekly doji capture real trading sessions with meaningful opens and closes. Stick to hourly charts and above for reliable doji signals.
Location is everything. A doji in the middle of nowhere tells you nothing. But a doji right at a level where the stock previously reversed multiple times? That's worth watching. Focus your attention on doji patterns at obvious decision points.
Frequently Asked Questions
Trading guides have been prepared by INGOT SC Ltd., for educational purposes only. This information is general in nature and should not be considered as personal recommendations.
Trading guides does not constitute personal advice and does not take into account your objectives, financial situation, or needs. You should carefully consider whether trading complex leveraged products, such as Contracts for Difference (CFDs), is appropriate for you given your circumstances.
CFDs are complex, leveraged products that carry a high risk of loss. The majority of retail investor accounts lose money when trading CFDs. You should ensure you understand how CFDs work and assess whether you can afford to take the high risk of losing your funds. If you are uncertain whether these products are suitable for you, consider obtaining independent financial advice before trading.
Any examples, patterns, or strategies discussed in this guide are based on historical data and market theory. Past performance is not a reliable indicator of future results. Market conditions can change rapidly, and technical patterns may fail without warning.

Learn how to read forex trading charts including line, bar, and candlestick types, OHLC data, timeframes, and support/resistance levels.
Read more
Risk management in trading protects your capital. Learn the 1-2% rule, stop-losses, and position sizing to limit losses and trade profitably.
Read more
Learn to read Japanese candlesticks, decode market psychology, and spot high-probability reversal patterns for smarter trading decisions.
Read more