
13 Chart Patterns Every Trader Needs to Know
Learn 13 essential chart patterns every trader should know: reversal, continuation, and candlestick formations for forex, stocks, and crypto.
Key takeaways:
- Chart patterns are visual formations that appear in price movements across different markets and timeframes.
- Reversal patterns signal potential trend changes, while continuation patterns suggest trend persistence.
- Trading patterns work across forex, stocks, and cryptocurrency markets because human psychology stays consistent.
- Volume confirmation significantly improves pattern reliability and breakout validity.
- Most successful traders focus on learning a core set of patterns rather than attempting to memorize dozens.
Chart patterns are recognizable formations created by price movements on trading charts. These visual structures develop as market participants react to price levels, news events, and each other's trading decisions. The patterns show up across different markets because human psychology in trading tends to repeat; emotions such as fear, greed, and uncertainty create similar price movements regardless of the underlying asset.
Technical analysts organize these formations into three main types: reversal patterns that indicate potential trend changes, continuation patterns that suggest trend persistence after consolidation, and bilateral patterns that can resolve in either direction.
Learning these price action patterns gives you a framework for interpreting market behavior and making trading decisions. Today, we will discuss 13 of the most common (and uncommon) chart patterns.
Understanding Chart Patterns in Technical Analysis
Price patterns form when market participants create recognizable shapes through their buying and selling activities. These formations develop over time and represent the collective psychology of traders and investors. When prices approach resistance levels multiple times without breaking through, it shows sellers defend that level. Similarly, when support holds repeatedly, it demonstrates buyers' willingness to purchase at that price.
The reliability of chart patterns comes from their basis in human psychology. Market participants experience similar emotional cycles: optimism near market peaks, pessimism during troughs, and uncertainty during consolidation periods. While you can't predict individual price movements, these psychological patterns occur frequently enough to give you statistical advantages.
Context makes a big difference in pattern effectiveness. Formations appearing at major support or resistance levels usually carry more weight than patterns forming without nearby reference points. Volume levels help confirm whether institutional participation supports the pattern development. The timeframe also matters; patterns on daily charts usually work better than those on shorter timeframes.
Trading patterns fall into three categories based on what they mean for future price movement. Each category serves different purposes in technical analysis and needs specific confirmation criteria before you act on the signals they give you.
Reversal Patterns That Signal Trend Changes
1. Double Top Pattern
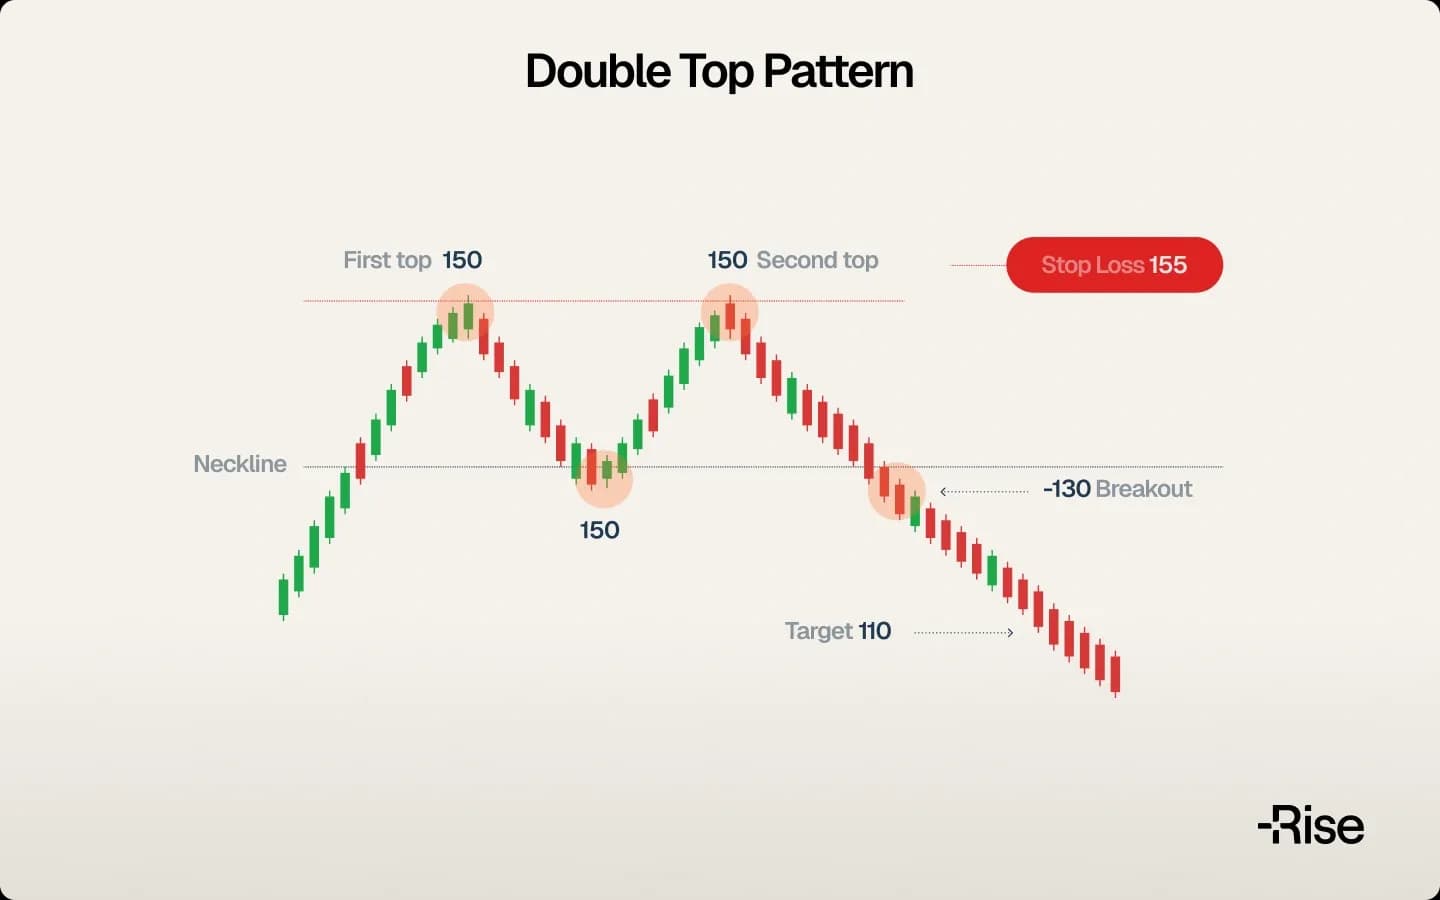
The double top pattern appears as two peaks at approximately the same price level, separated by a valley that forms the neckline. This formation resembles the letter "M" on a chart and develops when buyers push prices to a high, encounter selling pressure, then attempt another rally that fails to exceed the previous peak.
The pattern shows weakening upward momentum when the second peak can't surpass the first. Completion occurs when the price breaks below the neckline support level. The measured target often equals the distance from the peaks to the neckline, projected below the breakdown point.
2. Double Bottom Pattern
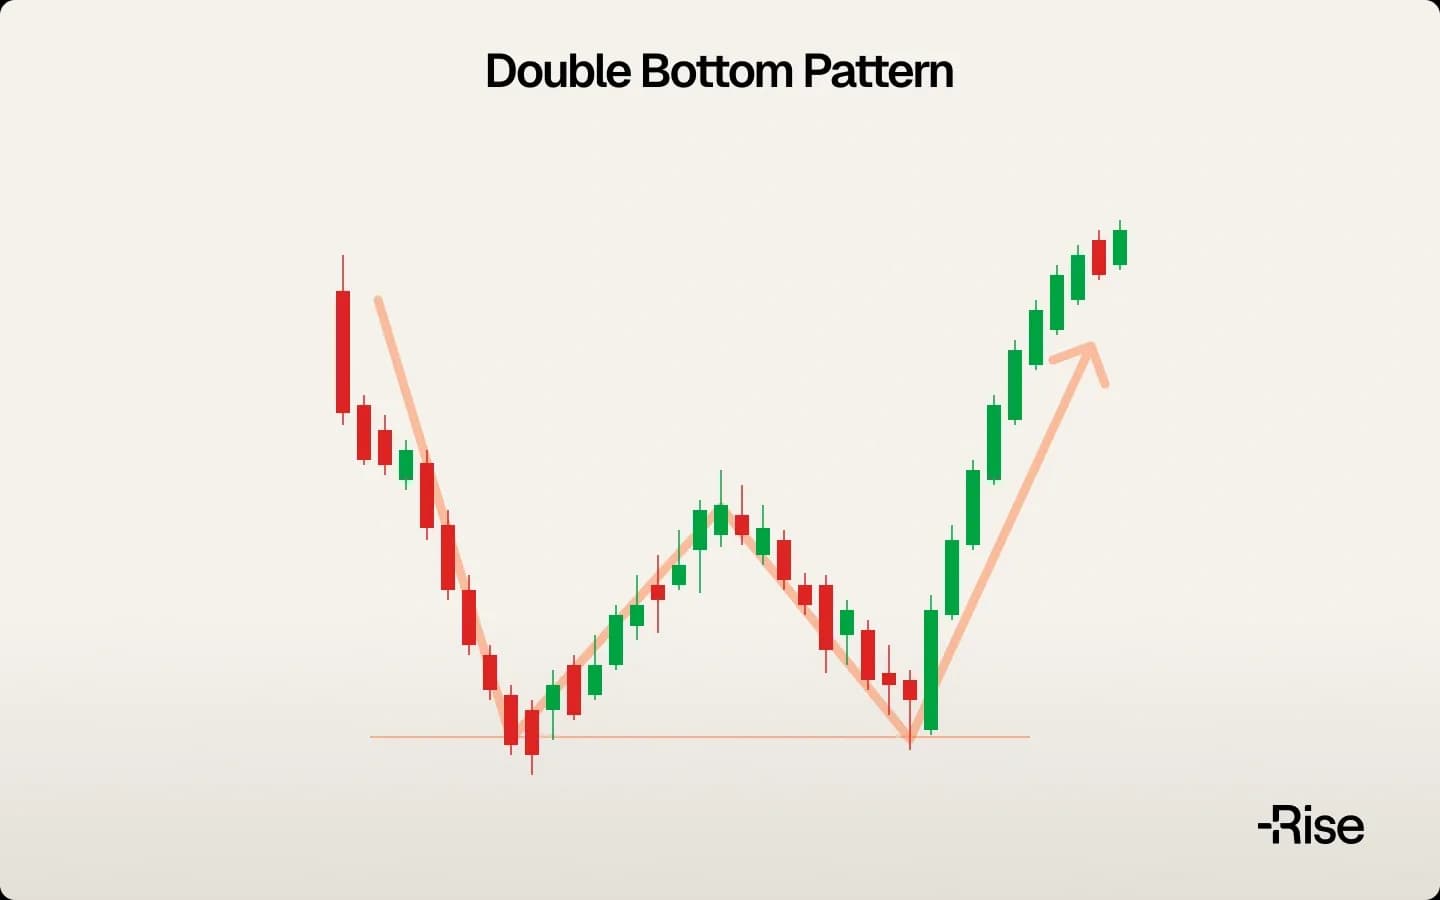
The double bottom pattern creates a "W" shape as prices bounce twice from similar levels. The peak between the two lows establishes neckline resistance. This formation suggests that sellers pushed prices down twice but couldn't maintain those lower levels, while the breakout above resistance confirms buyers have regained control.
Volume behavior often gives important confirmation with this pattern. Trading activity frequently increases on the second bottom and again on the breakout above the neckline, suggesting institutional interest is growing.
3. Head and Shoulders Pattern
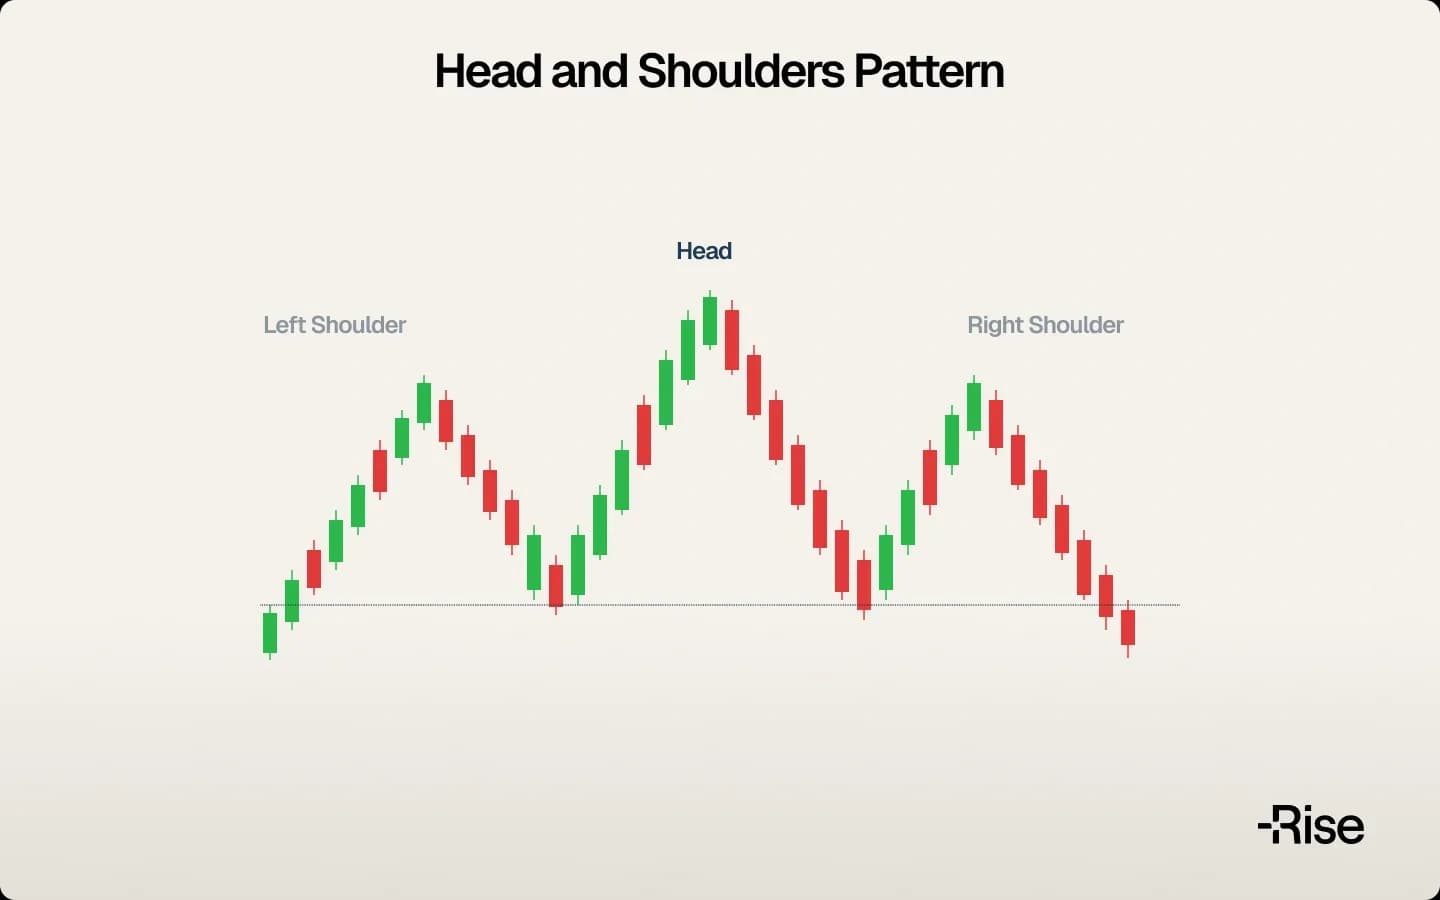
The head and shoulders pattern consists of three peaks: a central high peak (the head) flanked by two lower peaks (the shoulders). Technical analysts regard this as one of the most reliable reversal formations. The pattern develops as an uptrend reaches its climax at the head, followed by a failed attempt to continue the trend at the right shoulder.
The inverse head and shoulders appears at market bottoms with three troughs, where the middle trough extends deepest. Both variations suggest trend reversals when price breaks through their respective necklines.
Continuation Patterns That Confirm Trends
4. Triangle Patterns
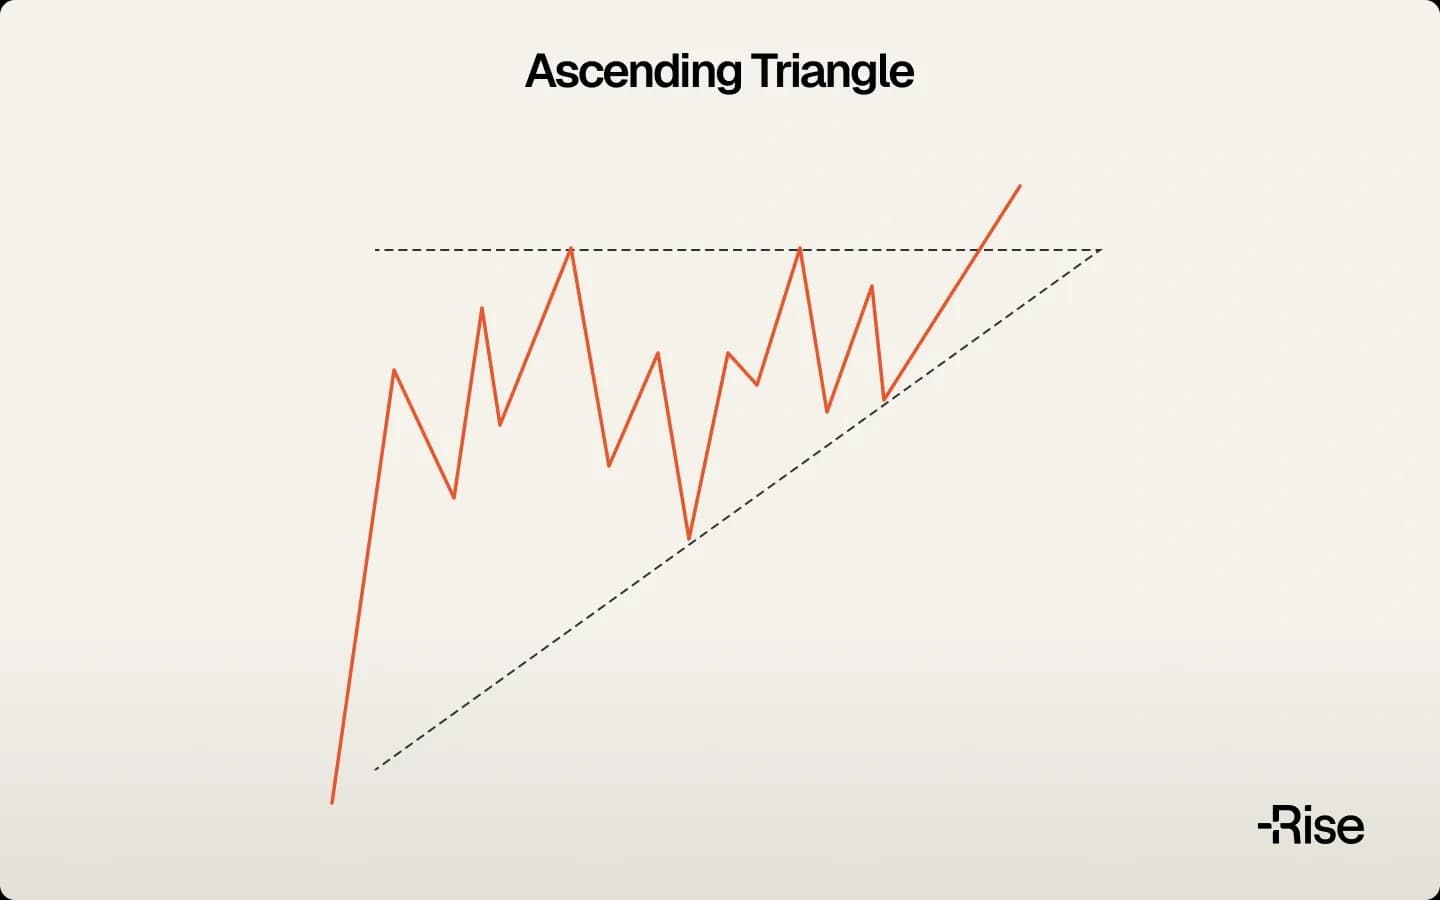
Triangle pattern formations develop as price action contracts between converging trend lines. The ascending triangle pattern displays horizontal resistance with rising support, often resolving upward when buyers overcome the resistance level. Descending triangles feature horizontal support with declining resistance, frequently breaking downward when support fails.
Symmetrical triangle patterns show both lines converging without clear directional bias. These bilateral formations can break in either direction, though they often continue in the direction of the preceding trend. Triangle pattern trading usually involves waiting for breakout confirmation before entering positions.
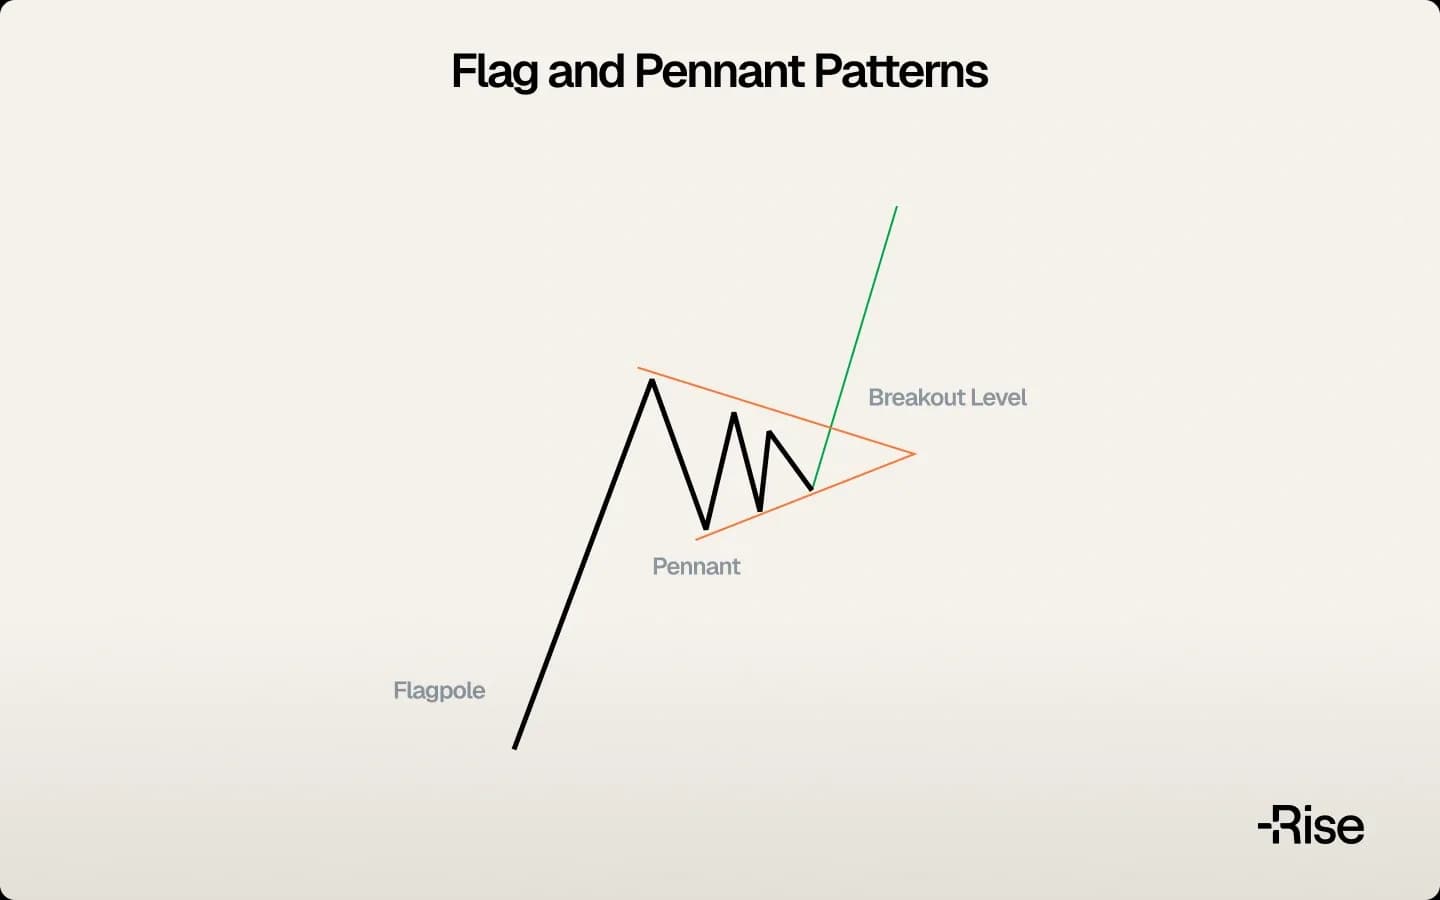
5. Flag and Pennant Patterns
Flags appear as brief rectangular consolidations after sharp price movements. The initial sharp move creates the flagpole, while the consolidation forms the flag itself. Bullish patterns of this type often slope slightly downward against the main uptrend before resuming higher.
The pennant pattern resembles small triangular consolidations that develop after sharp moves. Unlike flags with parallel boundaries, pennants show converging trend lines. The bearish pennant pattern forms after sharp declines, creating brief triangular consolidation before potential downtrend continuation.
6. Rectangle Patterns
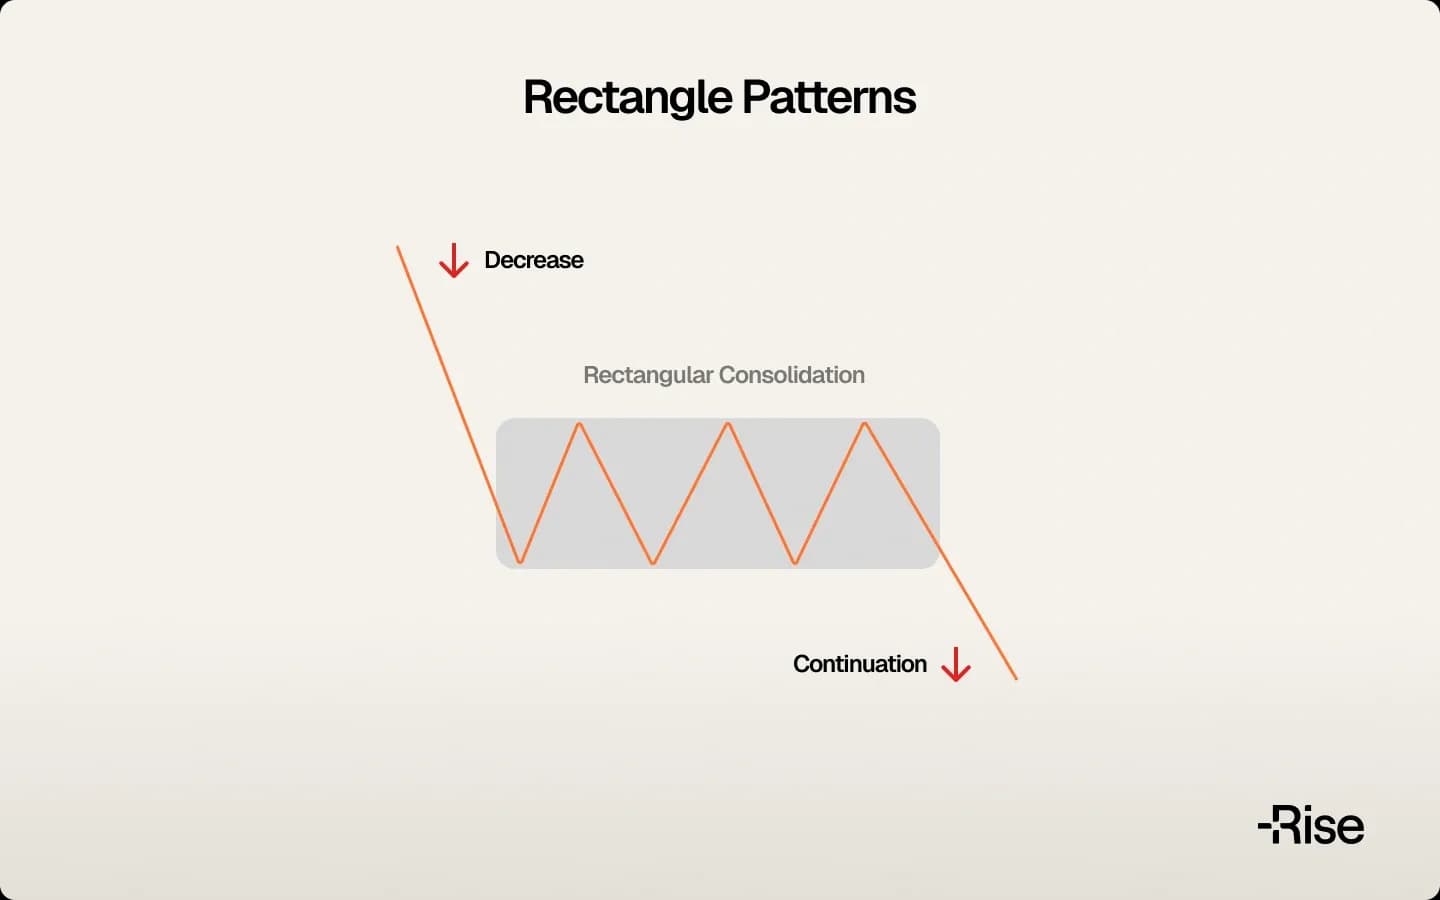
Rectangle formations develop when price oscillates between horizontal support and resistance levels, creating a box-like pattern. These consolidations can last for extended periods before the price eventually breaks out, often in the direction of the preceding trend.
Candlestick Patterns for Entry Timing
7. Hammer Candlestick Pattern
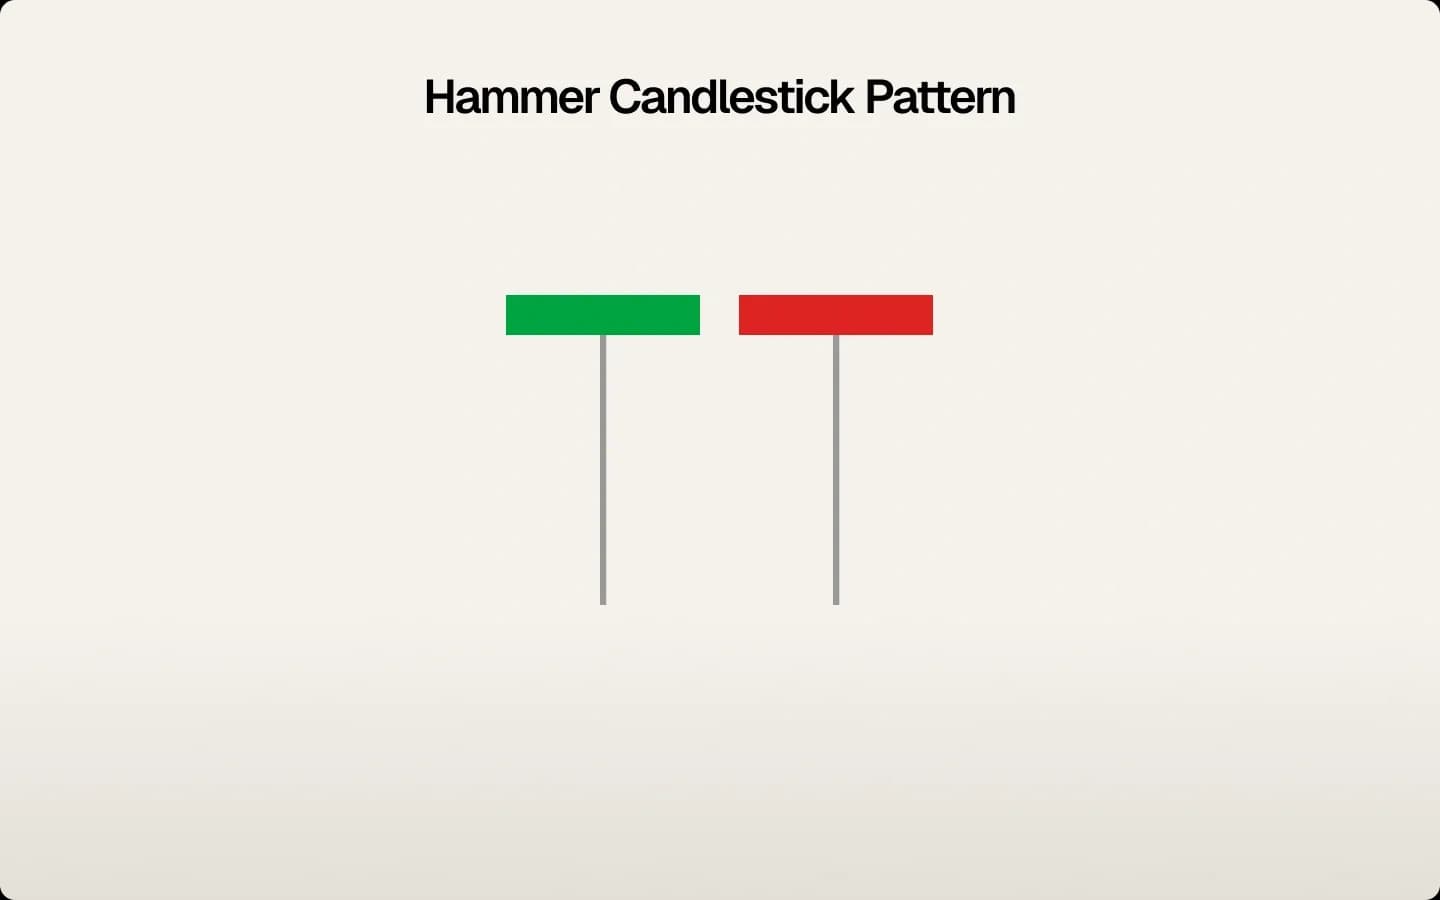
The hammer candlestick pattern appears as a candlestick with a small body and long lower shadow, usually after price declines. The hammer pattern suggests potential reversal when sellers push prices down during the session, but buyers manage to close near the highs. The shooting star presents the bearish equivalent with a long upper shadow after advances.
8. Morning Star Pattern
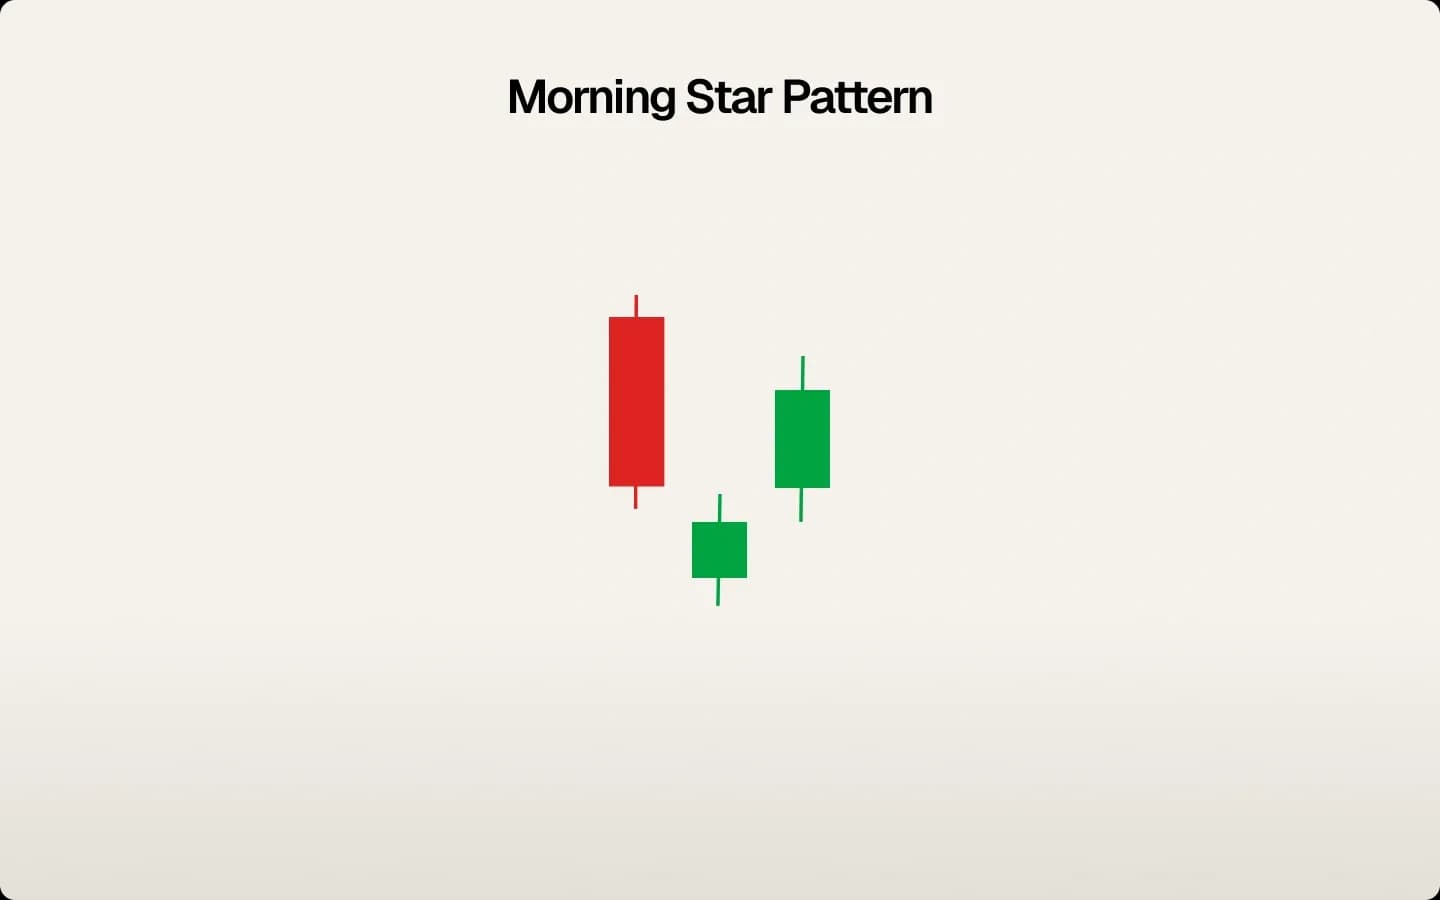
The morning star pattern consists of three candlesticks: a long bearish candle, followed by a small-bodied candle that gaps lower, completed by a long bullish candle. This sequence suggests a shift from selling pressure to buying pressure. The evening star gives the bearish counterpart at market tops.
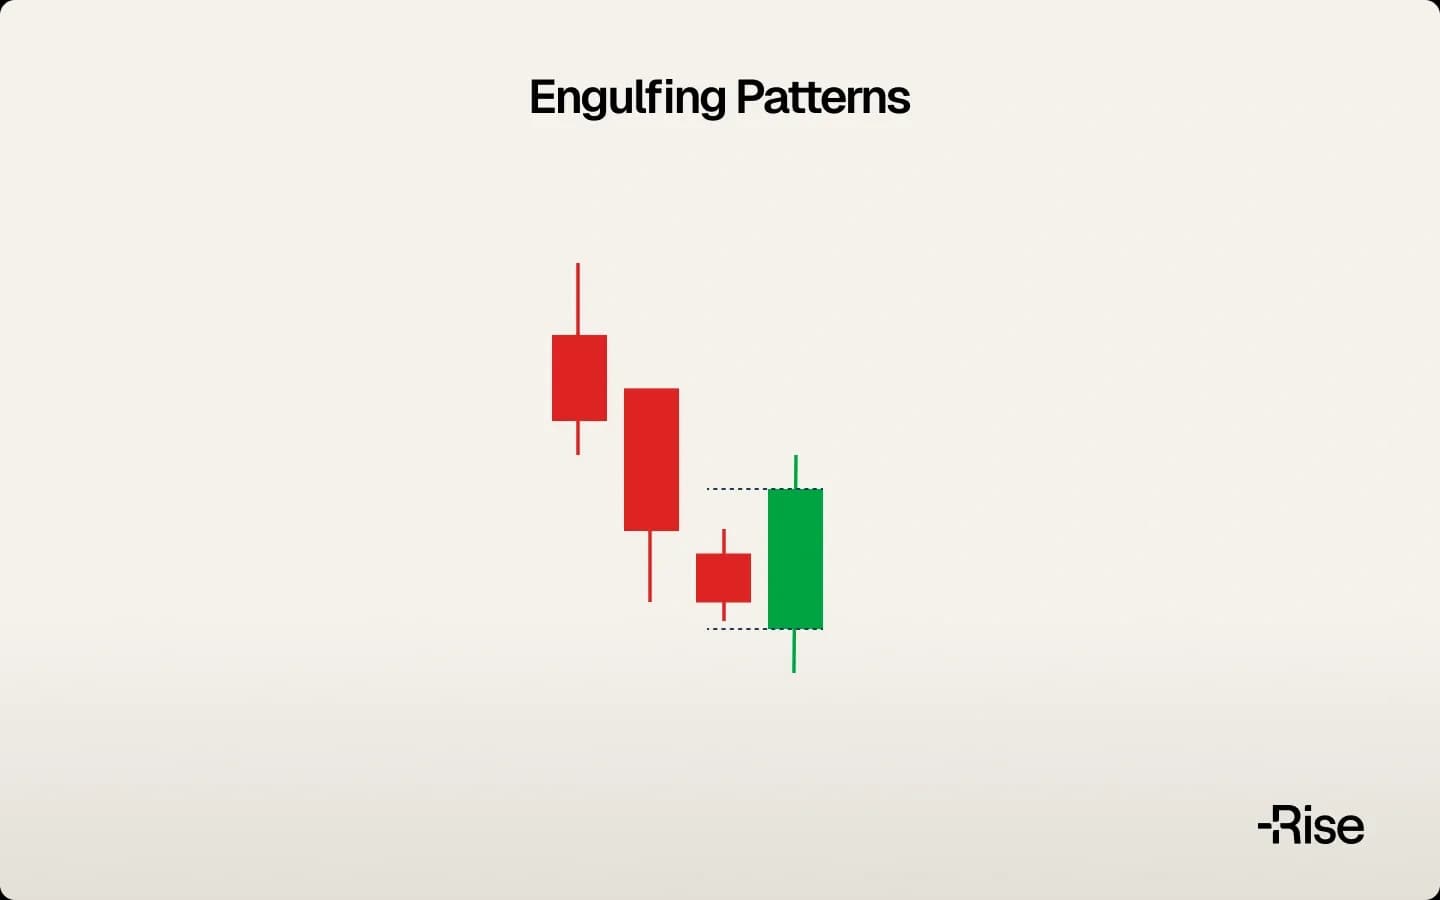
9. Engulfing Patterns
Engulfing formations occur when one candlestick's body completely encompasses the previous candlestick's body. A bullish engulfing pattern appears after declines, showing a large green candle that engulfs the prior red candle's body, suggesting buyers have overwhelmed sellers.
Advanced Formations
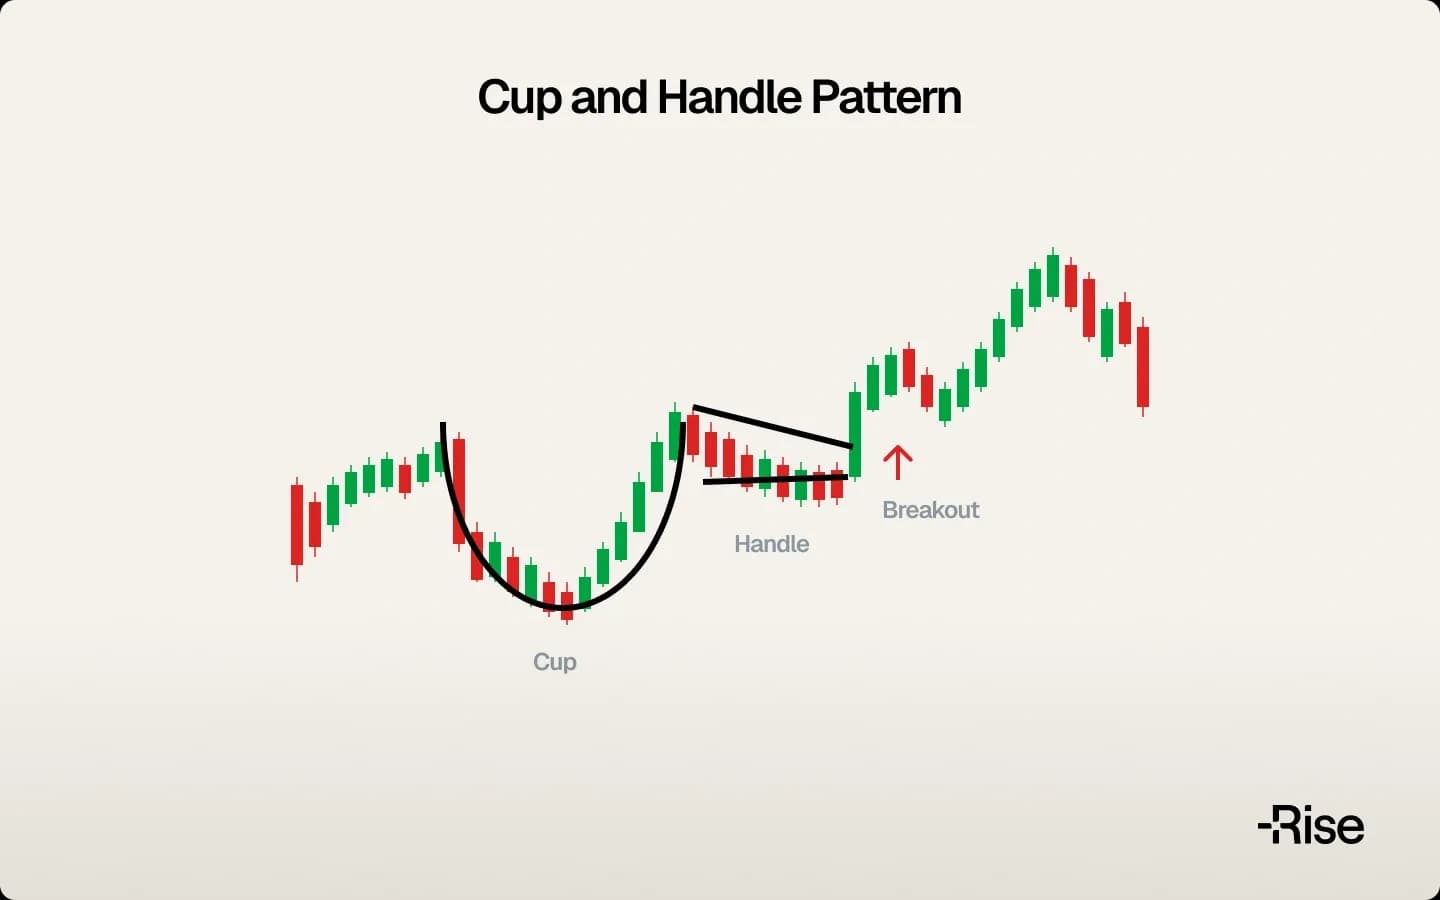
10. Cup and Handle Pattern
The cup and handle develops as prices form a rounded bottom (the cup) followed by smaller consolidation (the handle). This pattern often takes months to complete and frequently comes before substantial price moves. The cup should display a gradual "U" shape rather than sharp "V" formation.
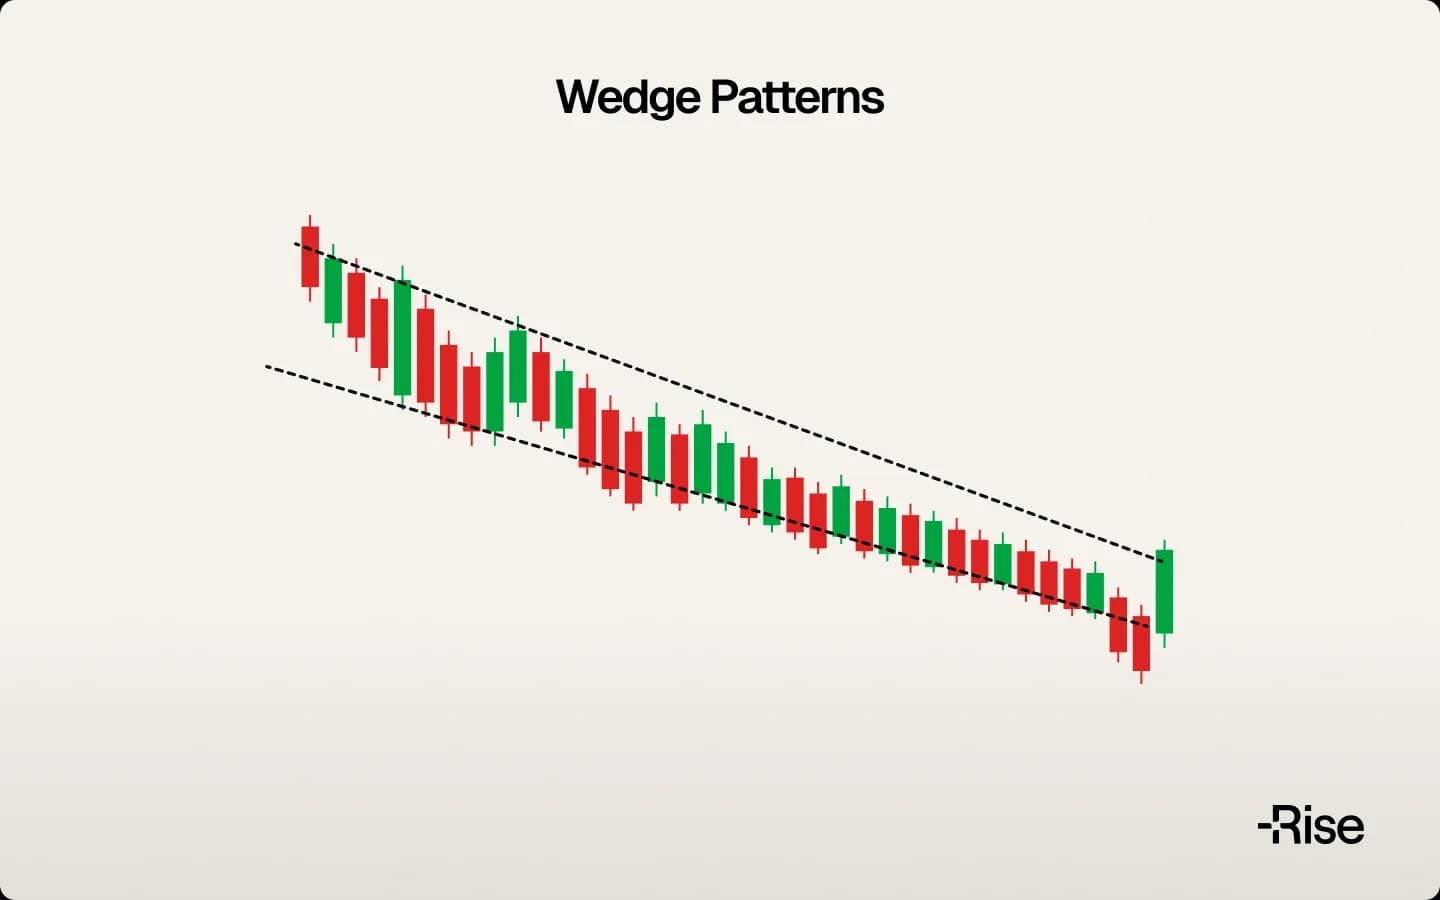
11. Wedge Patterns
Wedges display converging trend lines that both slope in the same direction, distinguishing them from triangles where lines usually slope oppositely. Rising wedges often appear after uptrends and may signal exhaustion, while falling wedges show opposite characteristics and potentially break upward.
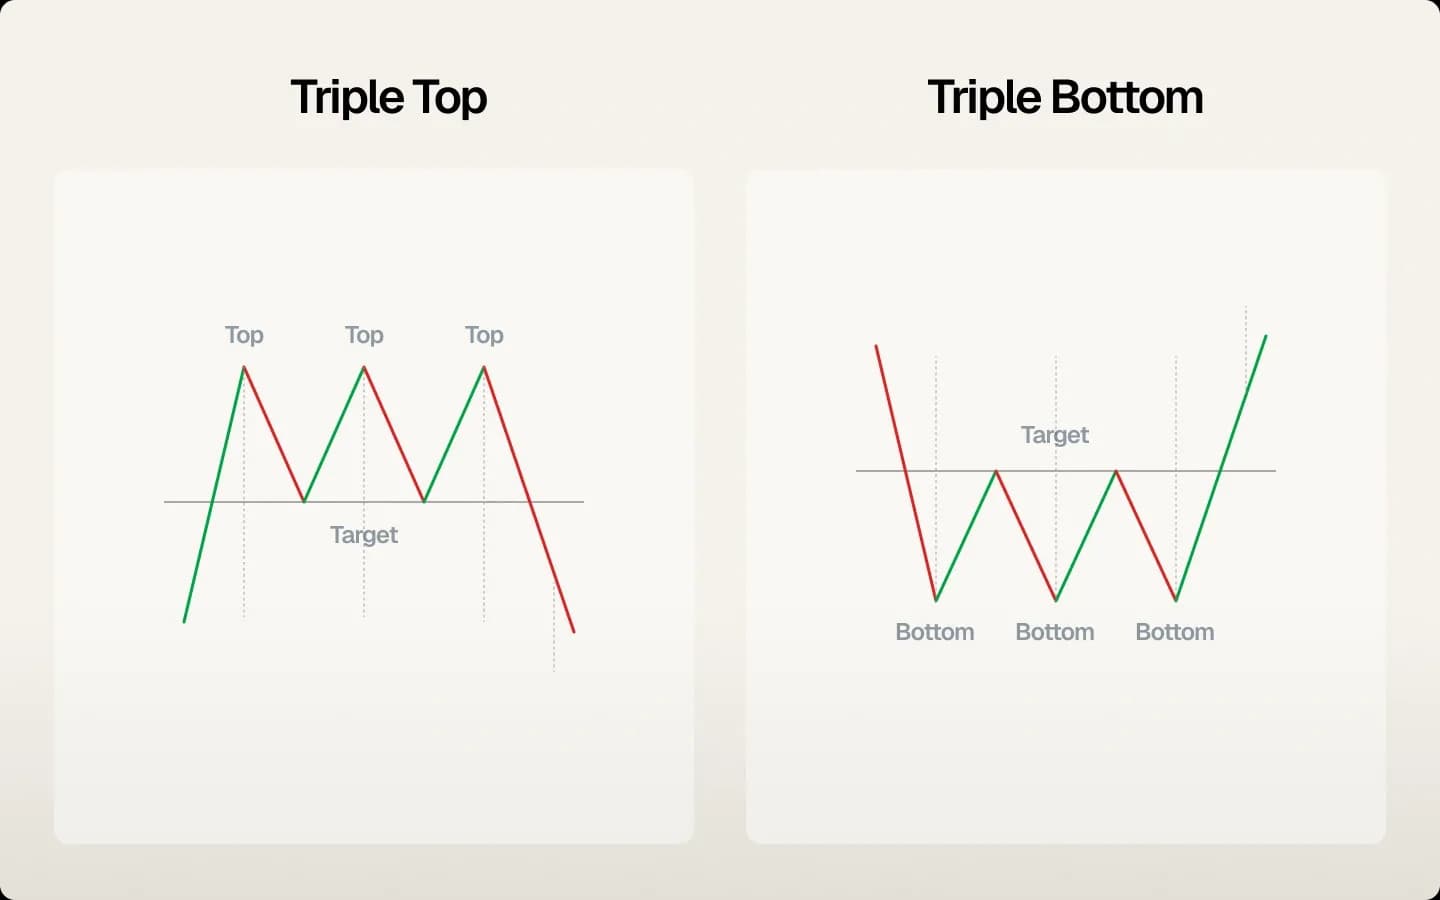
12. Triple Top and Bottom Patterns
Triple formations extend the double pattern concept with three tests of the same price level. Triple tops show three peaks at similar levels, while triple bottoms display three troughs. These patterns need more time to develop but may give stronger signals due to the multiple tests of support or resistance.
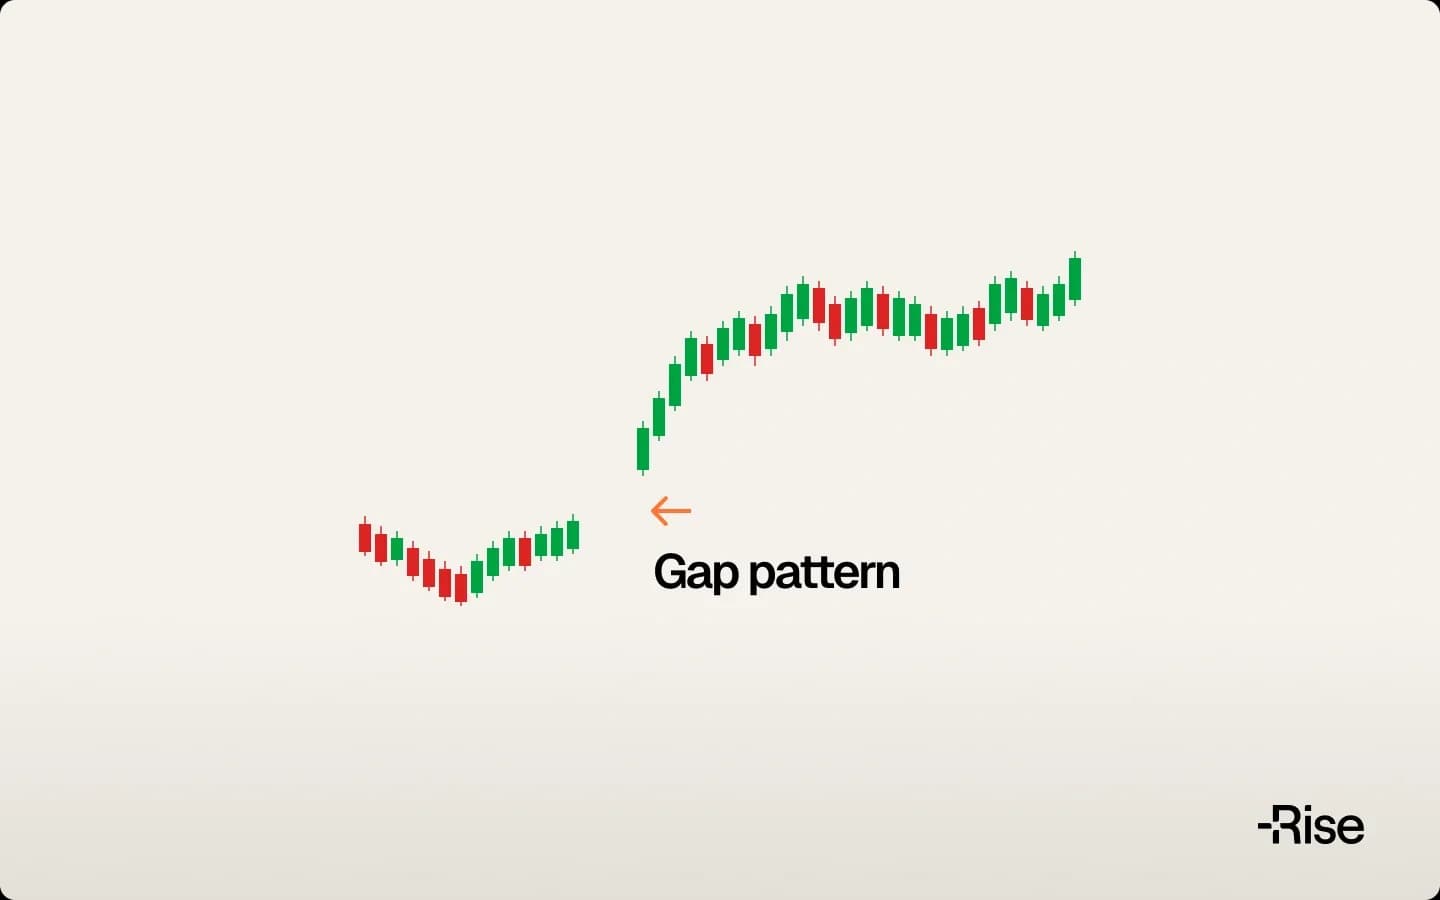
13. Gap Patterns
Gaps are areas where no trading occurs between two price levels, creating empty spaces on charts. Breakaway gaps form at trend starts, runaway gaps develop during trend middles, and exhaustion gaps appear near trend ends. Each type suggests different implications for future price movement.
Pattern Application Across Markets
Forex trading patterns work with 24-hour market dynamics but need adjustment for overnight volatility. Different currency pairs show varying volatility characteristics; patterns in major pairs like EUR/USD tend to develop more steadily than those in volatile pairs.
Stock market patterns benefit from distinct trading sessions that give clear volume data. Opening gaps can accelerate pattern completions or invalidate formations entirely. Earnings announcements and scheduled events can override technical patterns.
Cryptocurrency markets mix aspects of both forex and stock patterns. Continuous trading creates ongoing price action, while large holder influence can lead to sudden pattern breaks. Patterns in crypto markets often complete more quickly with larger percentage moves than traditional markets.
Risk Management and Common Mistakes
Pattern recognition errors happen frequently when you see formations that don't meet established criteria. Clear patterns should have well-defined boundaries and meet all requirements for that specific pattern type. Ambiguous formations are best avoided.
Volume analysis is important despite frequent oversight. Breakouts on declining volume fail more often than those with strong volume support. Context plays a key role; patterns forming at established support levels, resistance zones, or moving averages usually work better than those appearing at random price levels.
Premature pattern trading causes unnecessary losses. While waiting for confirmation might mean missing some moves, it substantially improves your overall success rates. Trade patterns work best when combined with additional confirmation criteria rather than used alone.
Conclusion
These 13 chart patterns represent basic technical analysis knowledge used across global markets. While many additional patterns exist, developing expertise with this core set gives you the foundation for pattern-based analysis. Trading patterns work as tools for market interpretation rather than guarantees of future price movement.
Beginning traders benefit from focusing initially on a few patterns through paper trading and small position sizes. You need to understand market context, manage risk well, and maintain discipline for successful pattern trading. Technology keeps advancing pattern recognition capabilities, but learning these basic formations stays valuable for market participants.
Frequently Asked Questions
Trading guides have been prepared by INGOT SC Ltd., for educational purposes only. This information is general in nature and should not be considered as personal recommendations.
Trading guides does not constitute personal advice and does not take into account your objectives, financial situation, or needs. You should carefully consider whether trading complex leveraged products, such as Contracts for Difference (CFDs), is appropriate for you given your circumstances.
CFDs are complex, leveraged products that carry a high risk of loss. The majority of retail investor accounts lose money when trading CFDs. You should ensure you understand how CFDs work and assess whether you can afford to take the high risk of losing your funds. If you are uncertain whether these products are suitable for you, consider obtaining independent financial advice before trading.
Any examples, patterns, or strategies discussed in this guide are based on historical data and market theory. Past performance is not a reliable indicator of future results. Market conditions can change rapidly, and technical patterns may fail without warning.

Learn how to trade Doji candlesticks: the three types, their success rates, and how to confirm reversals with volume and proper risk management.
Read more
Learn how to read forex trading charts including line, bar, and candlestick types, OHLC data, timeframes, and support/resistance levels.
Read more
Risk management in trading protects your capital. Learn the 1-2% rule, stop-losses, and position sizing to limit losses and trade profitably.
Read more