
5 Fibonacci Retracement Strategies for Technical Analysis
Master 5 Fibonacci retracement strategies including multi-timeframe analysis, moving average combinations, and extension targets to improve your trading decisions.
Key takeaways:
- Fibonacci retracement levels at 38.2%, 50%, and 61.8% show areas where price might pause during pullbacks, but they don't promise reversals will happen
- Multiple timeframe analysis finds spots where several fibonacci levels cluster together, creating potential support or resistance areas
- Combining fibonacci levels with moving averages can help with timing, but volatile markets may ignore both signals
- Fibonacci extensions at 127.2%, 161.8%, and 261.8% give possible profit targets, but news and market events can change price direction quickly
- Fibonacci tools stay subjective and work better with other analysis methods than alone
Leonardo Fibonacci introduced his number sequence to Europe in 1203. Today, traders use ratios from this math to analyze charts.
The fibonacci sequence starts: 0, 1, 1, 2, 3, 5, 8, 13, 21, 34. Each number equals the sum of the two before it. Traders focus on key ratios like 0.618 and 0.382 that emerge from these relationships.
Fibonacci retracement levels turn these math relationships into horizontal lines on price charts. When a stock moves from $100 to $200, the 61.8% retracement sits at $138.20. Traders watch these levels because buying or selling often happens there.
What Is Fibonacci Retracement?
Think of fibonacci retracement as a math ruler for measuring pullbacks. After a big price move, these tools show where a correction might pause or turn around before the main trend continues.
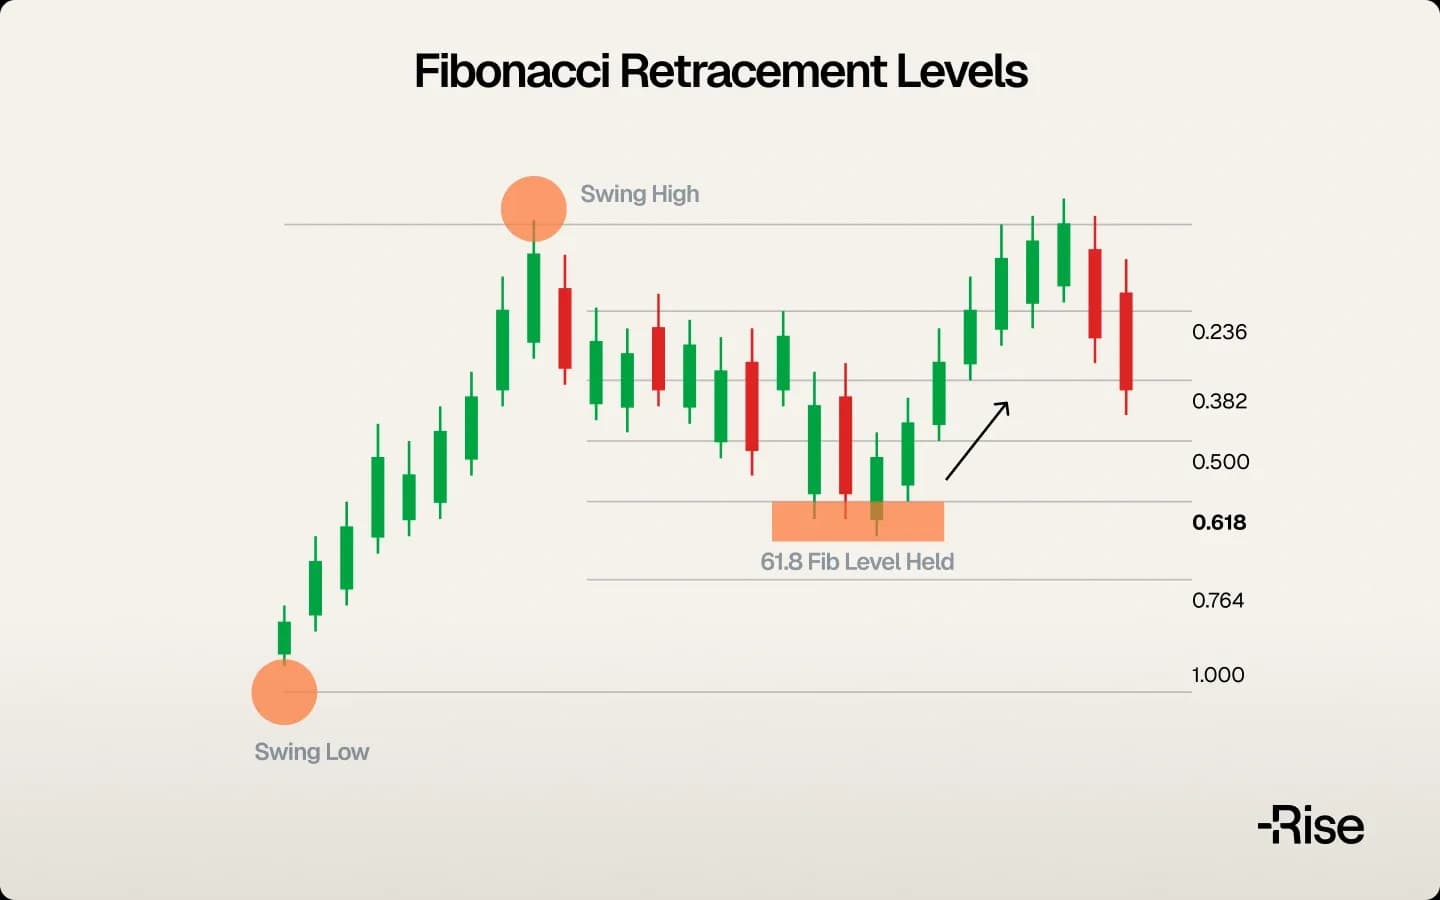
You start by picking two points: a recent high and low. Your trading platform draws horizontal lines at key percentage levels between those points. The main levels are 23.6%, 38.2%, 50%, 61.8%, and 78.6%.
The 50% level isn't from fibonacci numbers. People use it because halfway points are intuitive. Other levels come from the sequence. Take any fibonacci number and divide by the number two places ahead (21 ÷ 55 = 0.382).
Traders watch these levels because market psychology creates patterns. When thousands of traders focus on the same price areas, their collective buying and selling often creates reactions at those levels.
Classic Fibonacci Retracement Strategy
The basic fibonacci retracement strategy waits for trends to pull back before jumping in. Instead of chasing a stock that already moved 20% higher, you wait for it to retrace to a fibonacci level, then look for signs it's ready to go up again.
Here's an example: A tech stock climbed from $80 to $120 over several weeks. Rather than buying at the top, you draw fibonacci levels and wait. If the stock pulls back to $104 (the 61.8% retracement), you start watching.
But just reaching a fibonacci level doesn't mean buy. Smart traders look for extra confirmation: a bullish candlestick pattern, rising volume, or an oversold reading on the RSI indicator. These clues suggest real buying interest rather than just a brief pause before more selling.
Stop loss placement matters with this approach. If you're buying at the 61.8% level, you might put your stop just below the 78.6% retracement. This gives the trade room to move while limiting losses if the pullback continues.
The hard part is telling temporary pullbacks from trend changes. A healthy pullback in a strong uptrend usually stays above the 50% or 61.8% levels. Deeper pullbacks might mean the trend is getting weak or reversing completely.
Risk control stays essential. Position sizing should account for the distance between your entry and stop loss. A wider stop needs a smaller position size to keep consistent risk per trade.
Multi-Timeframe Fibonacci Analysis
Markets exist across multiple time periods at once. A pullback on the daily chart might be a continuation pattern on the weekly chart. This creates opportunities for traders who check fibonacci levels on different timeframes.
Start by finding the main trend on a longer timeframe like daily or weekly charts. After marking big highs and lows, you'll see key fibonacci retracement levels. Then zoom into shorter timeframes like 4-hour or hourly charts to look at recent price action.
Good things happen when fibonacci levels from different timeframes come together. Say the 61.8% retracement on a daily chart sits at $147.50, while the 38.2% retracement on a 4-hour chart lands at $147.20. This tight cluster creates what traders call a confluence zone where multiple technical factors line up.
These confluence zones often get stronger reactions than single fibonacci levels. The reason is simple: more traders watch these areas, creating more buying or selling pressure when price gets there.
Timing entries gets more precise with this method. The longer timeframe gives context and finds the major levels to watch. Shorter timeframes help pinpoint exact entry points within those zones. You might wait for a bullish reversal pattern on the 1-hour chart near a confluence area you found on the daily chart.
The downside is more complexity. Looking at multiple timeframes takes more time and can lead to overthinking. Some traders start seeing patterns everywhere, making it harder to focus on the best setups.
Advanced Fibonacci Tools Strategy
Beyond basic retracements are more complex tools: fibonacci fans, arcs, and time zones. Advanced methods try to include both price and time in market analysis, but they need more experience to read correctly.
Fibonacci fans create diagonal lines going out from a low point through fibonacci percentages of a high point. These slanted lines often act as moving support or resistance as price moves through time. Unlike horizontal retracement lines, fans adjust to the angle of the underlying trend.
Fibonacci arcs draw curved lines that combine price retracements with time projections. These tools suggest not just where price might reverse, but when such reversals might happen. Where arcs meet with price action can signal potential turning points.
Time zones apply fibonacci ratios to time periods rather than prices. If a big move took 21 days to complete, fibonacci time zones would highlight day 34, 55, and 89 as potential dates for future trend changes.
Using these tools together creates what some traders call "Fibonacci clusters" - areas where multiple fibonacci-based projections come together. When a traditional retracement level lines up with a fan line and an arc, while also happening near a fibonacci time zone, it might deserve extra attention.
However, advanced tools might overwhelm new traders. The extra lines and curves on charts might seem more precise while actually making decisions harder. Most traders find more value in mastering basic retracements before trying these complex alternatives.
Fibonacci Extension Strategy
While retracements look back at pullbacks, extensions look forward to estimate where trends might end. These tools use three reference points - typically the start of a move, its end, and the following pullback - to project potential price targets.
Common extension levels include 127.2%, 161.8%, and 261.8% of the original move. If a stock rallied $20 and then pulled back $8, the 161.8% extension would project a target $32.36 above the original starting point.
This forward-looking approach helps with profit-taking decisions. Instead of holding positions forever or exiting randomly, traders can scale out at predetermined fibonacci extension levels. The 161.8% extension, coming from the golden ratio, gets particular attention from technical analysts.
Position management becomes more systematic with extensions. You might take one-third profits at the 127.2% level, another third at 161.8%, and hold the final portion for the 261.8% target. This method gets gains while keeping exposure to potentially bigger moves.
Real-world use needs flexibility. Market conditions change, news events happen, and trends end unexpectedly. Extension levels provide guidance, not guarantees. A stock might reach the 127.2% target and then reverse, never getting to higher extensions.
The psychological part matters too. Selling into strength at extension levels often feels uncomfortable because momentum looks unstoppable. However, disciplined traders know that extensions help find areas where trends might run out of steam.
Frequently Asked Questions
Sources: Investopedia, "What Are Fibonacci Retracement Levels, and What Do They Tell You?" Investopedia Technical Analysis, August 29, 2025.

Master how to trade Forex with our comprehensive guide to currency trading, education, and how to start.
Read more
Learn trading from scratch: Master forex basics, risk management, trading psychology, and proven strategies to make your first trade in 90 days.
Read more
Learn the basics of trading and forex, from how currency pairs work to managing risk, and discover why discipline matters more than luck in financial markets.
Read more